


Thomas Chuang

Software Engineer

As a software engineer and researcher, I specialize in Vision AI, highly concurrent systems, and clean architecture.

Go Bears!

Thomas Chuang
Software Engineer 0.99
Thomas Chuang (back)
Map Enthusiast & Adventurer! 0.99

Education

University of California, Berkeley logo

University of California, Berkeley

Concurrent Enrollment StudentComputer Science

Aug 2025 – May 2026

Berkeley, CA

  • Relevant: CS 61C (Machine Structures), CS 162 (Operating Systems), Data 100 (Data Science)
  • Planned: CS 164 (Compilers), CS 161 (Computer Security)
National Chengchi University logo

National Chengchi University

Dual Bachelor of Arts in Risk Management & Insurance and Land EconomicsMinor in Management Information Systems

Sep 2020 – Jun 2026

Taipei, Taiwan

  • GPA: 3.86/4.00 • CS Field GPA: 3.98/4.00
  • Relevant: Data Structures (A+), Algorithms (A+), DBMS (A+), Software Engineering (A+)
Peking University logo

Peking University

Exchange Student

Feb 2024 – Jun 2024

Beijing, China

  • Relevant: Deep Learning Models and Applications, Data Visualization

Professional Experience

Ultralytics logo

Ultralytics

Associate Software Engineer

Aug 2024 – Present

Remote

  • Built real-time collaboration with FastAPI WebSockets + Redis for concurrent multi-user editing (sub-100ms perceived latency).
  • Designed conflict-safe state updates using optimistic concurrency (ETags) to preserve integrity under race conditions.
  • Integrated Segment Anything Model (SAM) for auto-labeling, reducing manual annotation time by ~40% on vision datasets.
  • Orchestrated CI/CD workflows for the open-source repo (57.2k stars), improving release reliability for global users.
Esri R&D Center logo

Esri R&D Center

Product Engineer Intern

Apr 2024 – Aug 2024

Beijing, China

  • Improved ArcGIS Earth 3D interaction by profiling rendering bottlenecks and reducing frame drops.
  • Prototyped a GPT-4o geospatial assistant to automate SQL-style queries and map generation from natural language.
  • Strengthened product stability through regression testing and code review practices for enterprise releases.
Academia Sinica logo

Academia Sinica

Undergraduate Researcher

Jul 2023 – Dec 2024

Taipei, Taiwan

  • Researched automated feature extraction for historical maps by combining YOLOv5 with Segment Anything (SAM), achieving an F1 Score of 0.90.
  • Built a full-stack vectorization & verification system (Flask, PostgreSQL, Docker, OpenLayers).

Projects

Selected work — research-driven, visual, and interactive.

Ultralytics Platform
End-to-End Computer Vision Platform (2024 - Present)

A comprehensive, end-to-end computer vision platform that streamlines the ML workflow from data preparation to model deployment. As an Annotation Lead, I contributed to building an ecosystem that supports dataset management, SAM-based smart annotation, YOLO auto-labeling, cloud training, and global model deployment.

  • Led annotation tools development including Manual, SAM smart annotation, and YOLO auto-labeling across 5 task types.
  • Scalable infrastructure managing 4K+ datasets, 14M+ images, and deploying to 43 global regions.
  • Comprehensive ML lifecycle support: Upload, Annotate, Train (22 cloud GPUs), Export (17 formats), and Deploy.
Detect annotation: forklift in warehouse

Manual detection — bounding boxes for forklift + safety classes on a warehouse scene

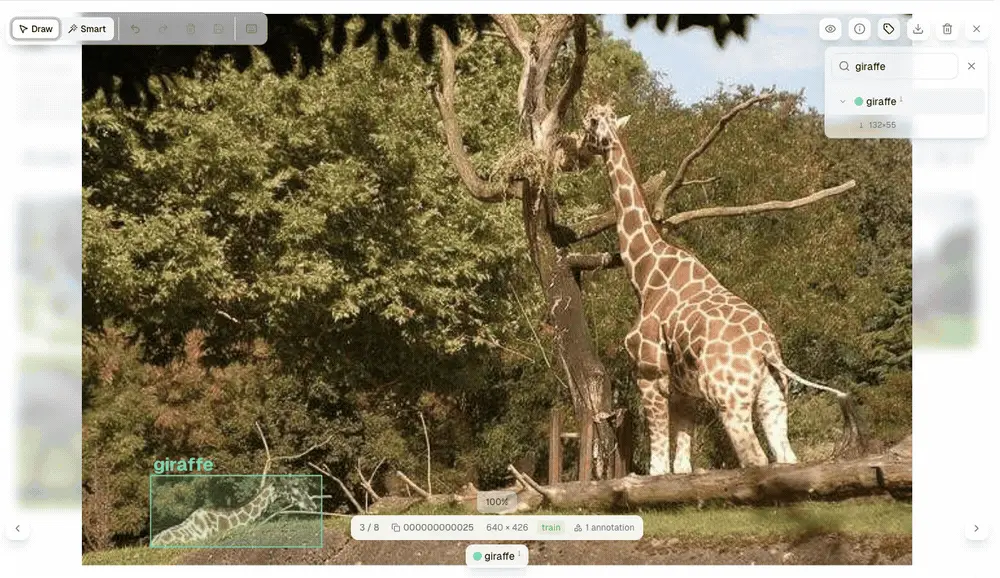
Segmentation annotation: giraffe

Manual instance segmentation — polygon mask outlining a giraffe

SAM smart annotation: forklift

SAM-powered smart annotation — one click produces a tight forklift mask

Pose annotation: equestrian rider

Pose task — keypoint skeleton on an equestrian rider

OBB annotation: aerial sports complex

Oriented bounding boxes on aerial imagery (DOTA-style classes)

Multi-class segmentation: PPE workers

Multi-class instance segmentation — workers + safety vests on a warehouse floor

Annotation class color picker

Per-class color picker for label visualization

Project training metrics

Project view — precision / recall / mAP curves streamed across multiple training runs

Project models table view

Models table — per-run training hyperparameters at a glance

ChronoScape
VLM · Vector Search · Street View · San Francisco

Search a city by what it looks like. ChronoScape encodes Google Street View imagery with SigLIP into a vector index and lets you query by text or image — results rendered as a heatmap on an interactive Mapbox map.

  • Multilingual search — query in English, Chinese, Japanese, or any language SigLIP understands; the model maps all languages into the same embedding space.
  • Cross-modal: upload an image to find visually similar street scenes; text and image queries share the same vector index.
  • Milvus vector DB over geo-tagged Street View embeddings; results rendered as an Inferno heatmap on Mapbox GL.

End-to-end demo: text + image search rendered as a heatmap on Mapbox

Query: Golden Gate Bridge

Text query "Golden Gate Bridge" — heatmap clusters tightly along the bridge span

Query: China Town

Text query "China Town" — heatmap concentrates around SF's Chinatown blocks

Japanese query for neon scenes

Japanese query for neon-lit scenes — same SigLIP embedding space as English queries

Image similarity query

Upload a reference photo and find visually similar street scenes via the same vector index

Historical Map of Taiwan Based on GeoAI
TGIS Best Paper
YOLOv5 + SAM (2023) · YOLOv8 Instance Segmentation (2024)

Developed an automated pipeline for digitizing historical maps using GeoAI. By advancing from YOLOv5+SAM to YOLOv8 Instance Segmentation, the system significantly improves vectorization quality, addressing the critical bottleneck of manual feature extraction in digital humanities and historical geography.

  • Labeled 8 land-use classes and synthesized training data via random crop-composition to improve generalization.
  • Upgraded from object detection to instance segmentation, improving the quality of map feature extraction.
  • Result visualizations include detection, labeling, and prediction comparisons; packaged as a PDF report.
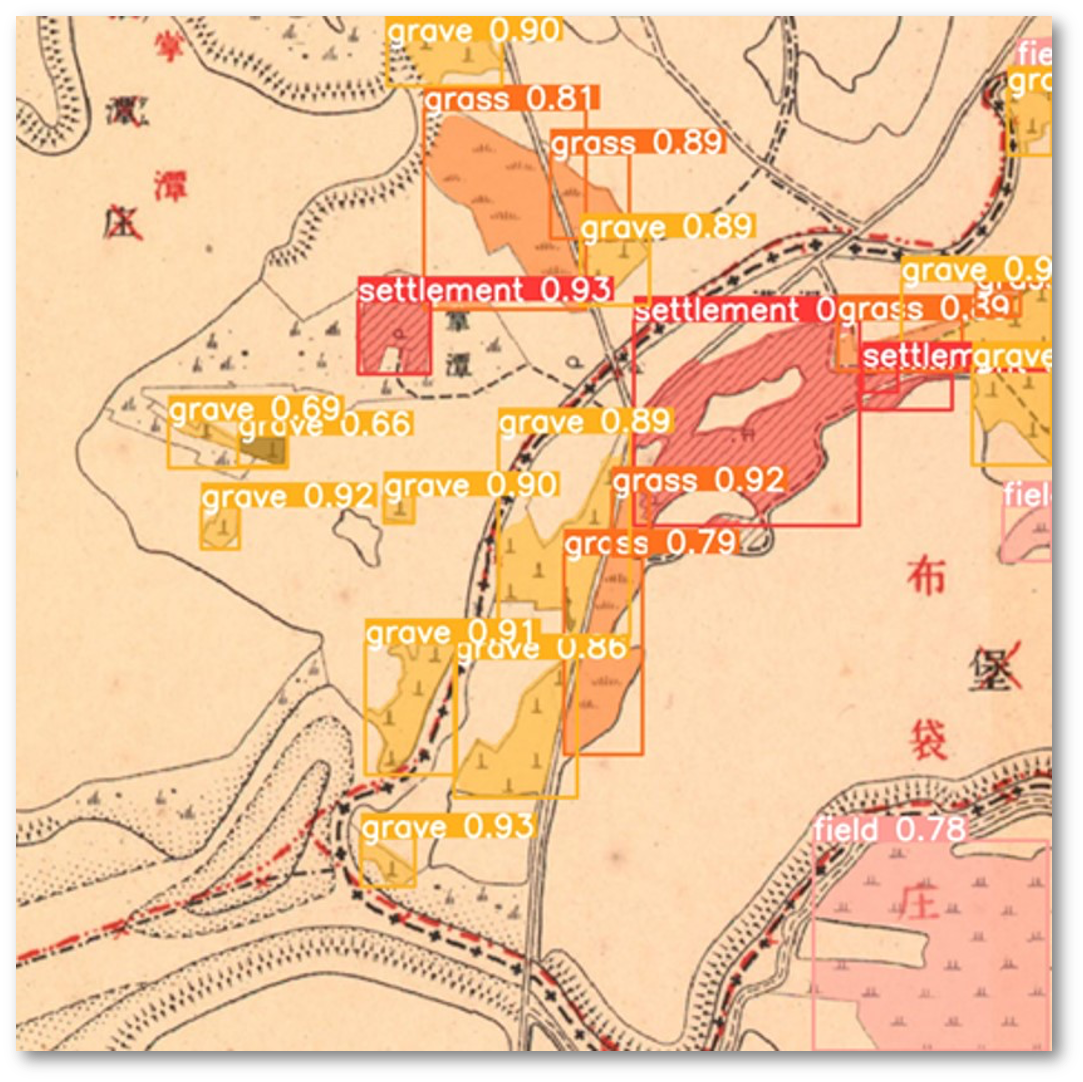
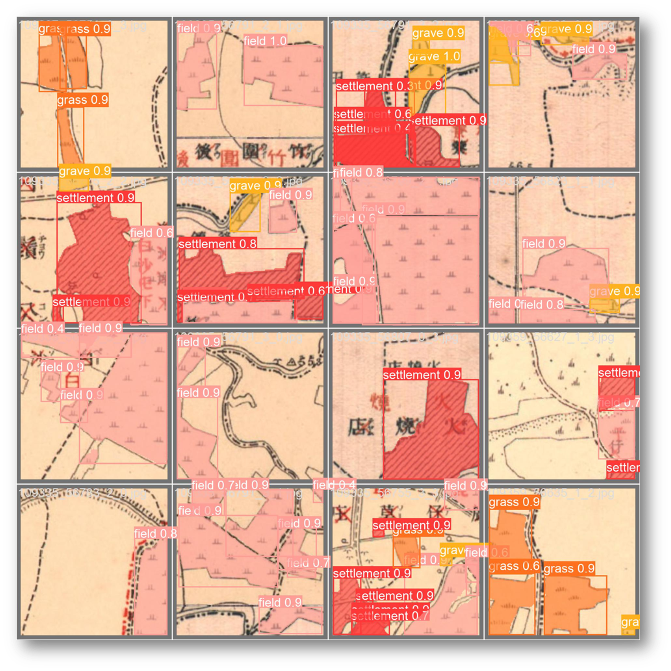
YOLOv5 detection on historical map

YOLOv5 detection on a Japanese-era Taiwan map — grave / grass / settlement / field with confidence scores

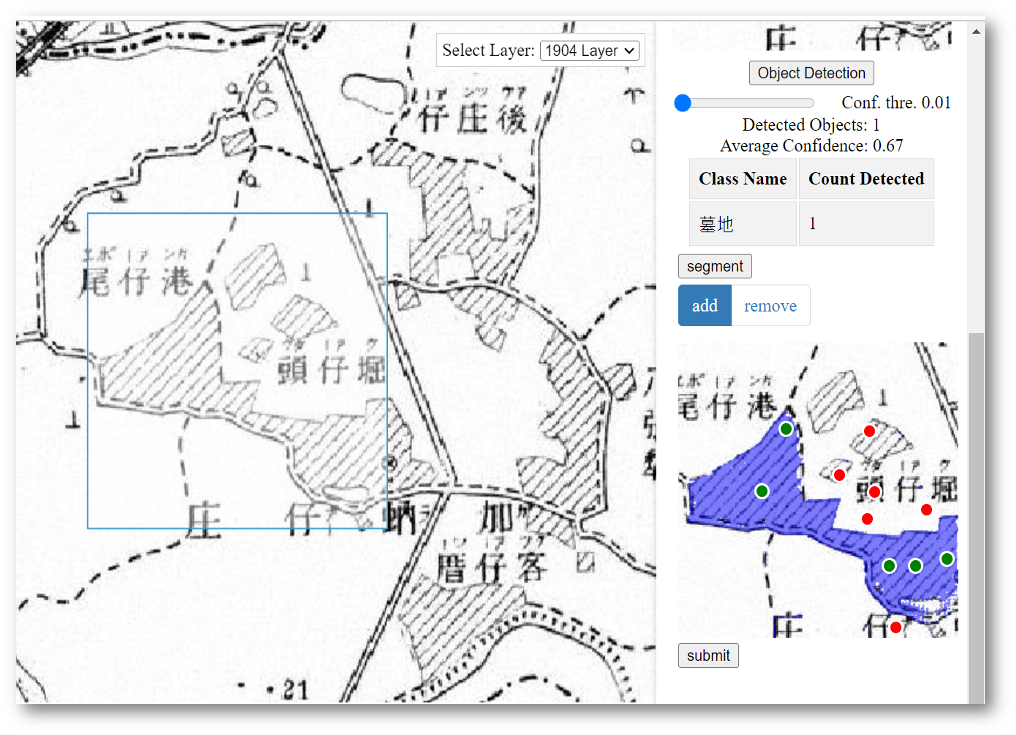
Verification web tool

Web tool for vector verification: tile selector, detection results, and per-class counts

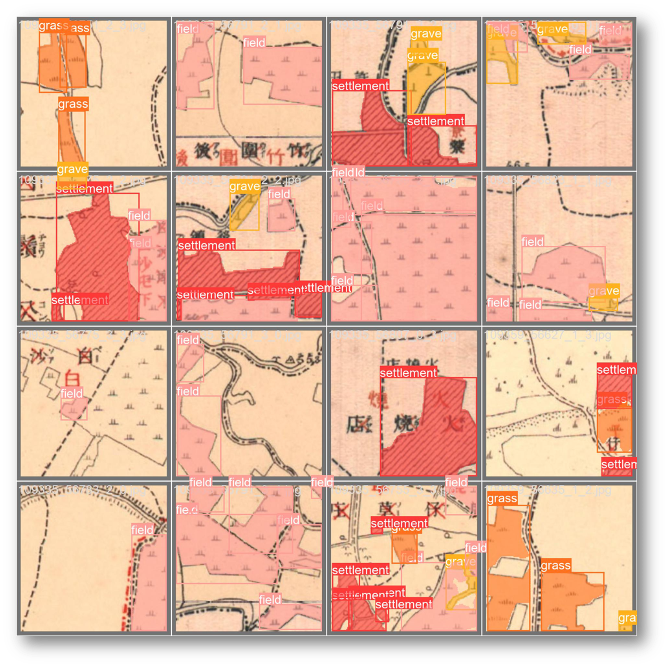
Ground-truth label tiles

Ground-truth tiles (red overlays mark labeled land-use)

Predicted label tiles

Model predictions on the same tiles — directly comparable to ground truth

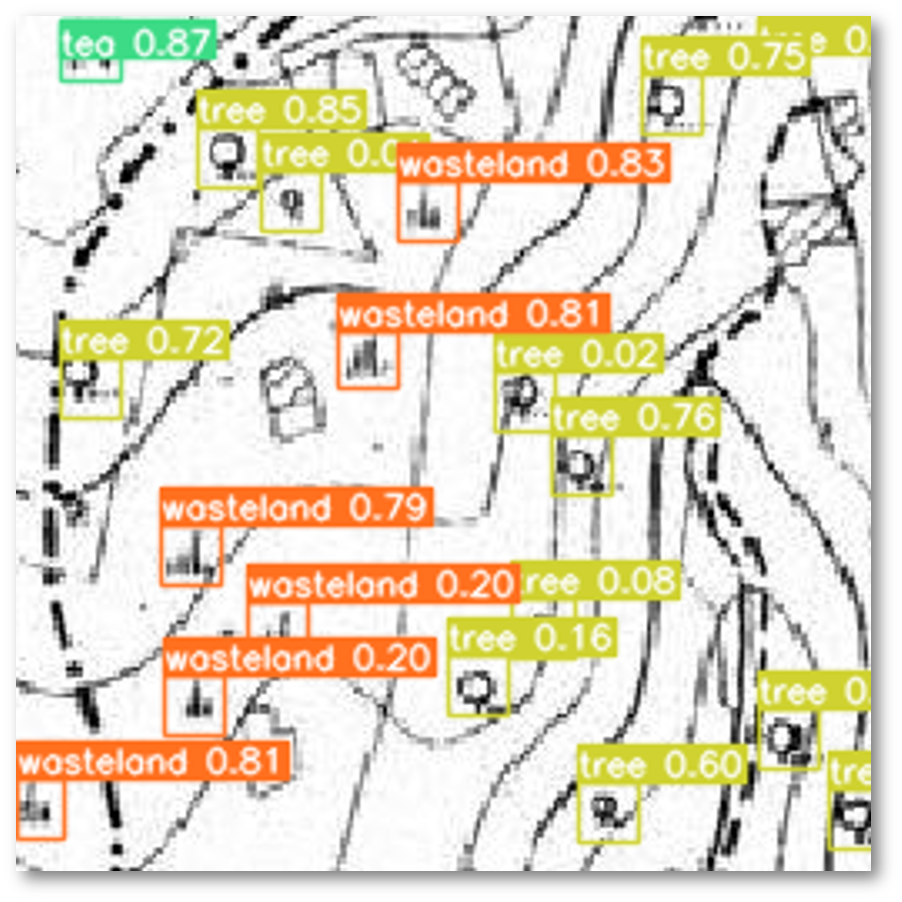
YOLOv8 result — tree / wasteland

YOLOv8 instance results on a hatched-relief tile (tree / wasteland)

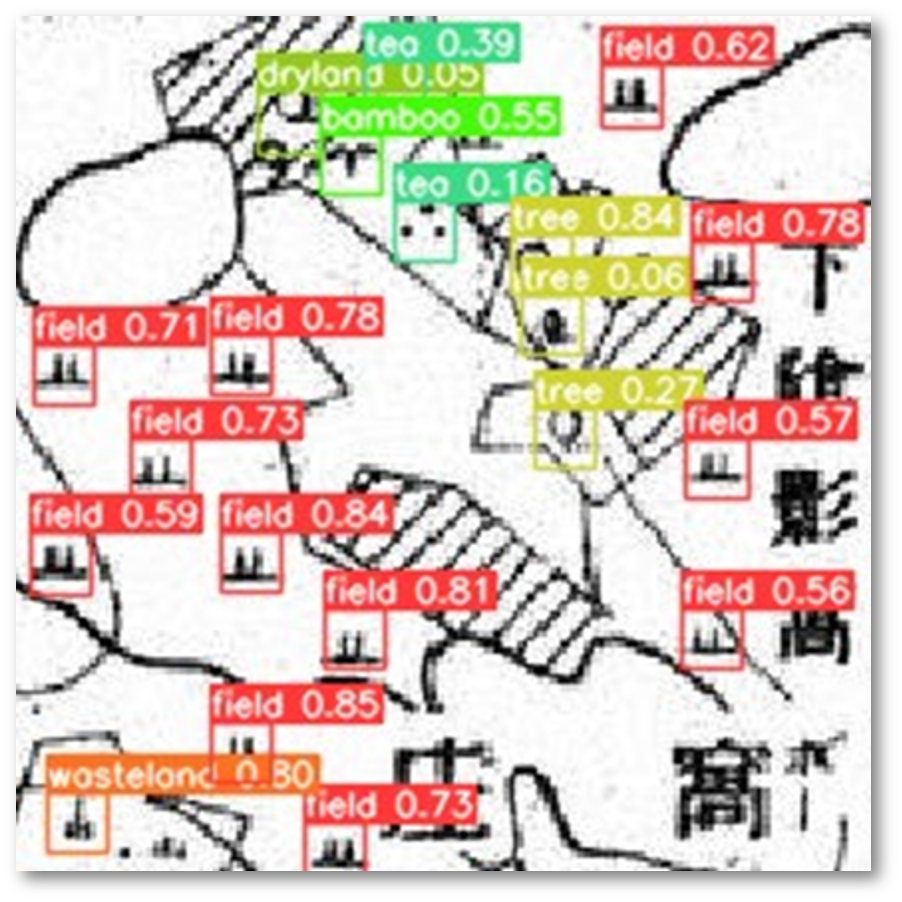
YOLOv8 result — multi-class

YOLOv8 multi-class results: field / tree / tea / bamboo / wasteland

Pmap — The Map for Precipitation 🌦️
Crowdsourced Reports + CWA Data · Subscription & Notifications · Cloud-Native

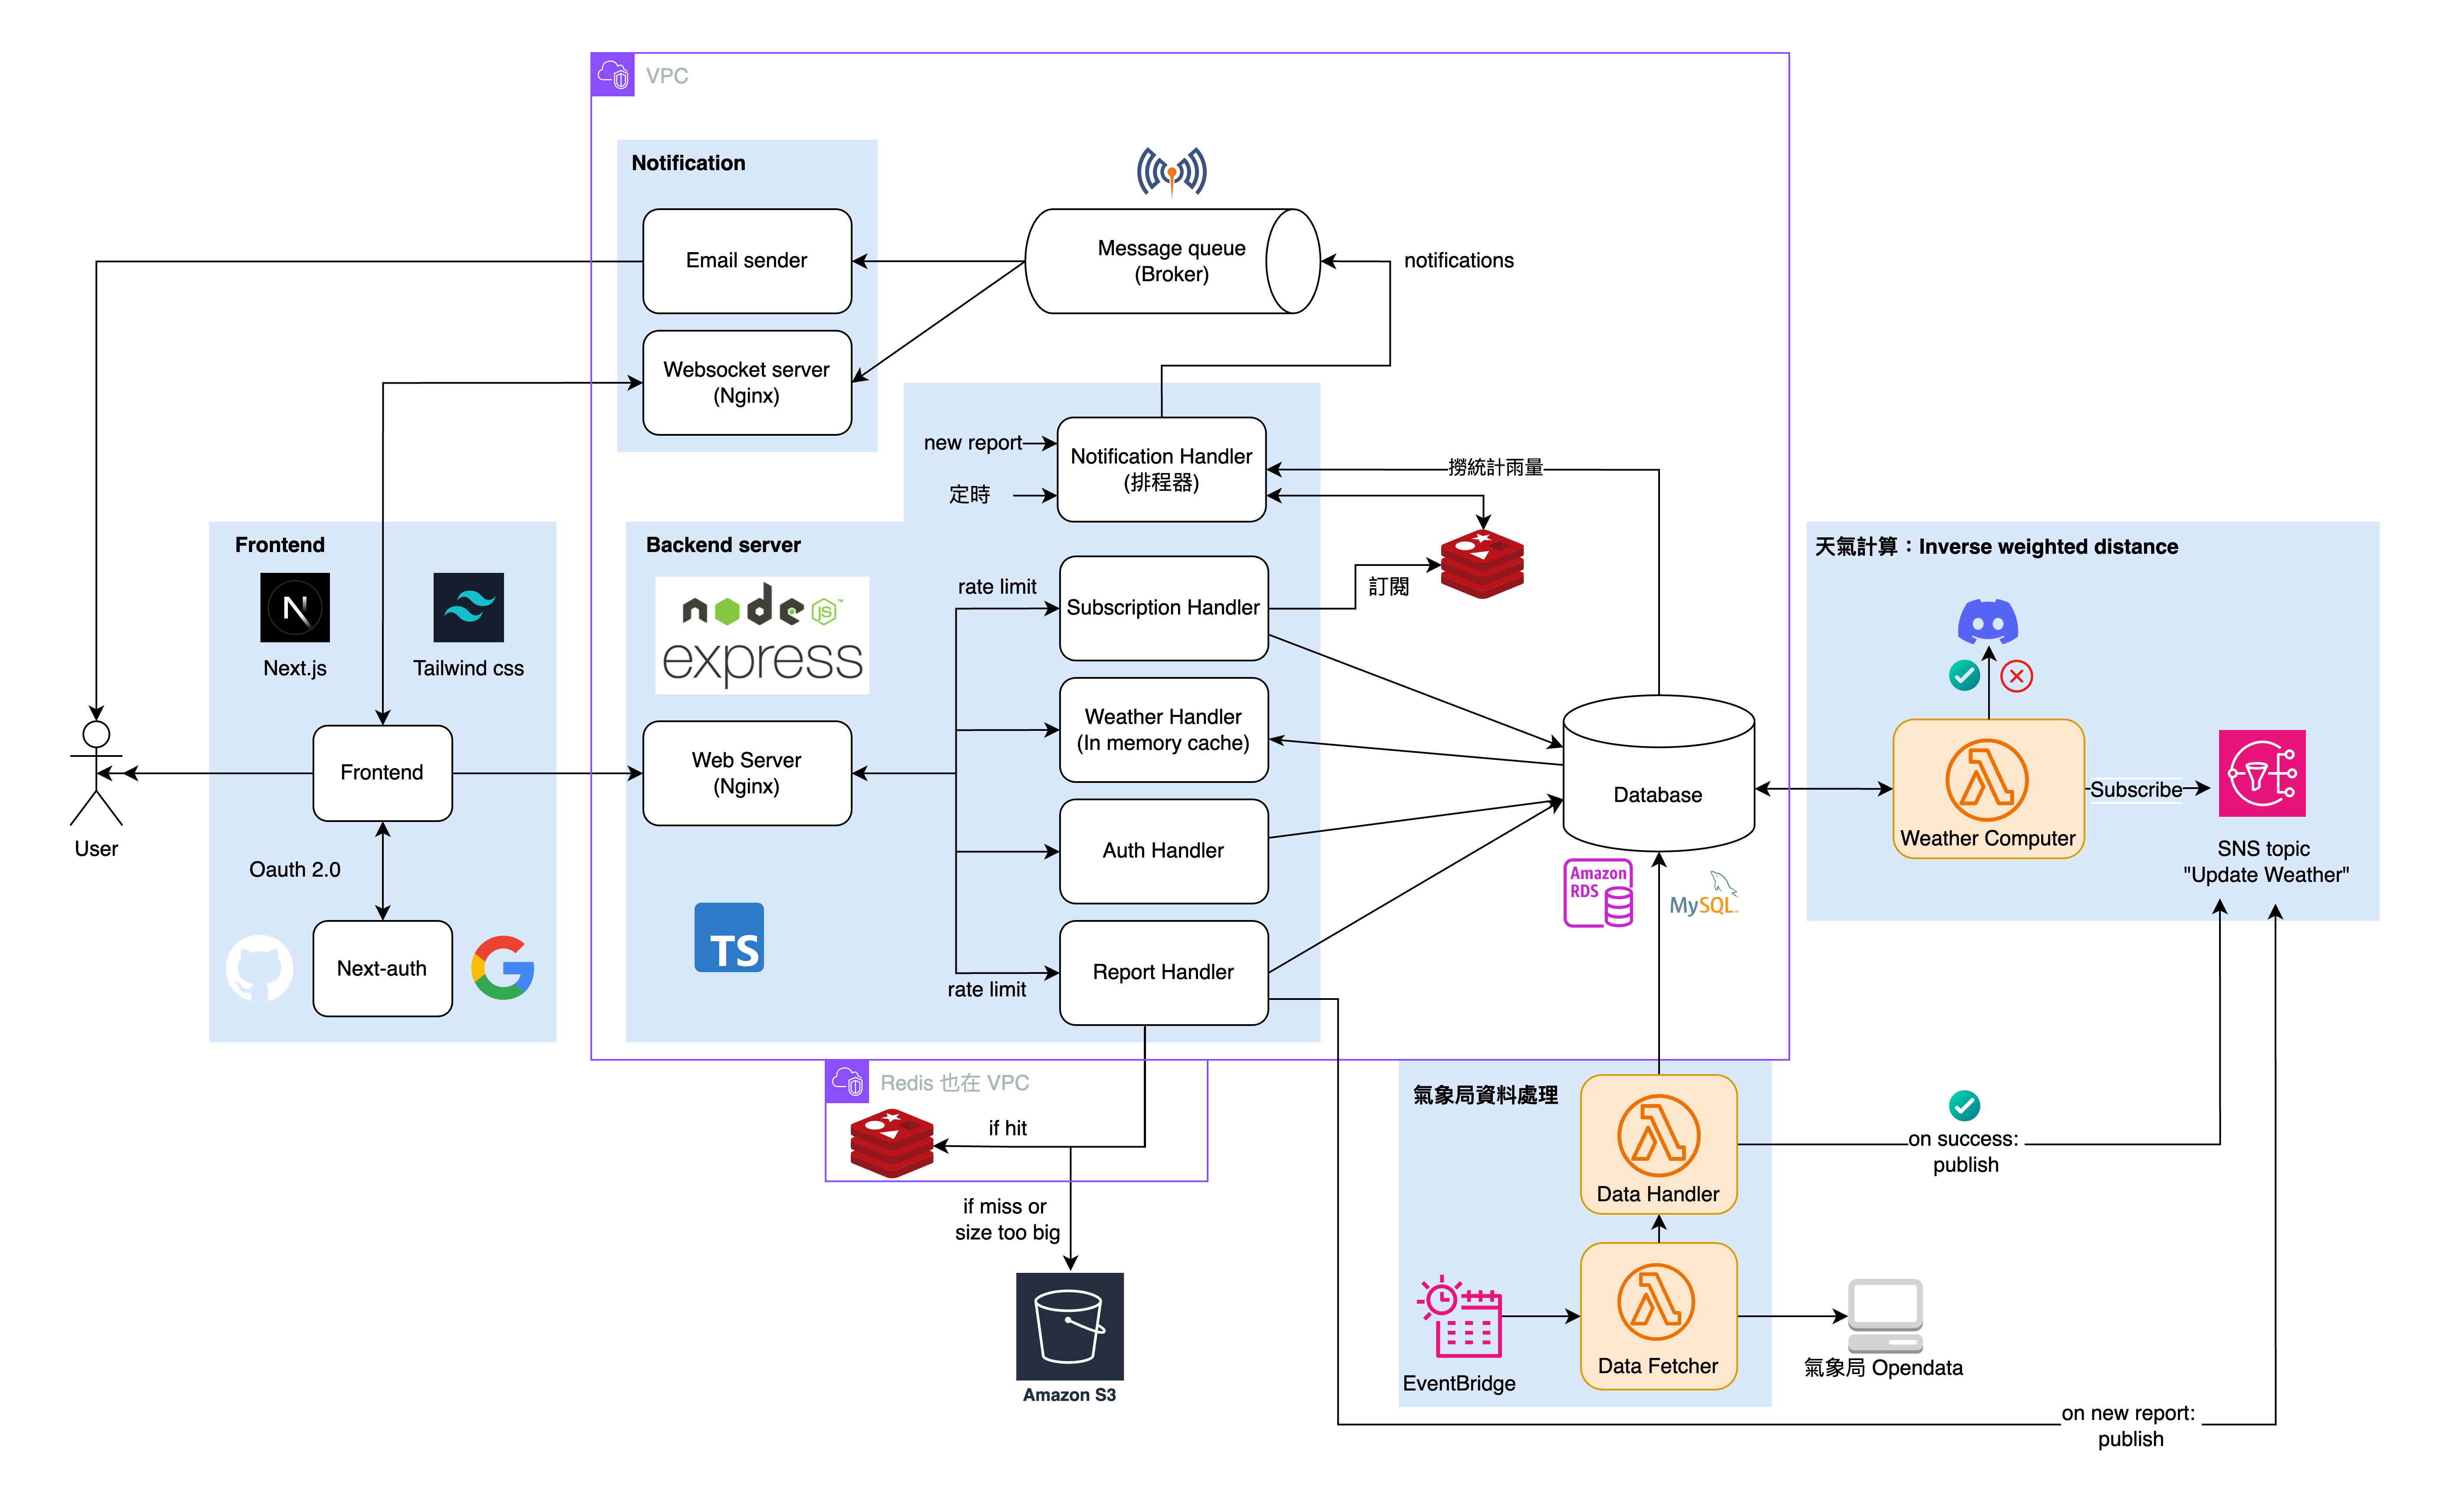
Designed and implemented a cloud-native platform that fuses crowdsourced reports with official meteorological data to deliver real-time, high-precision precipitation mapping. The system resolves the challenge of localized weather prediction through scalable infrastructure and an interactive, real-time notification engine.

  • Fusion of public rain reports + CWA data to compute more accurate precipitation conditions.
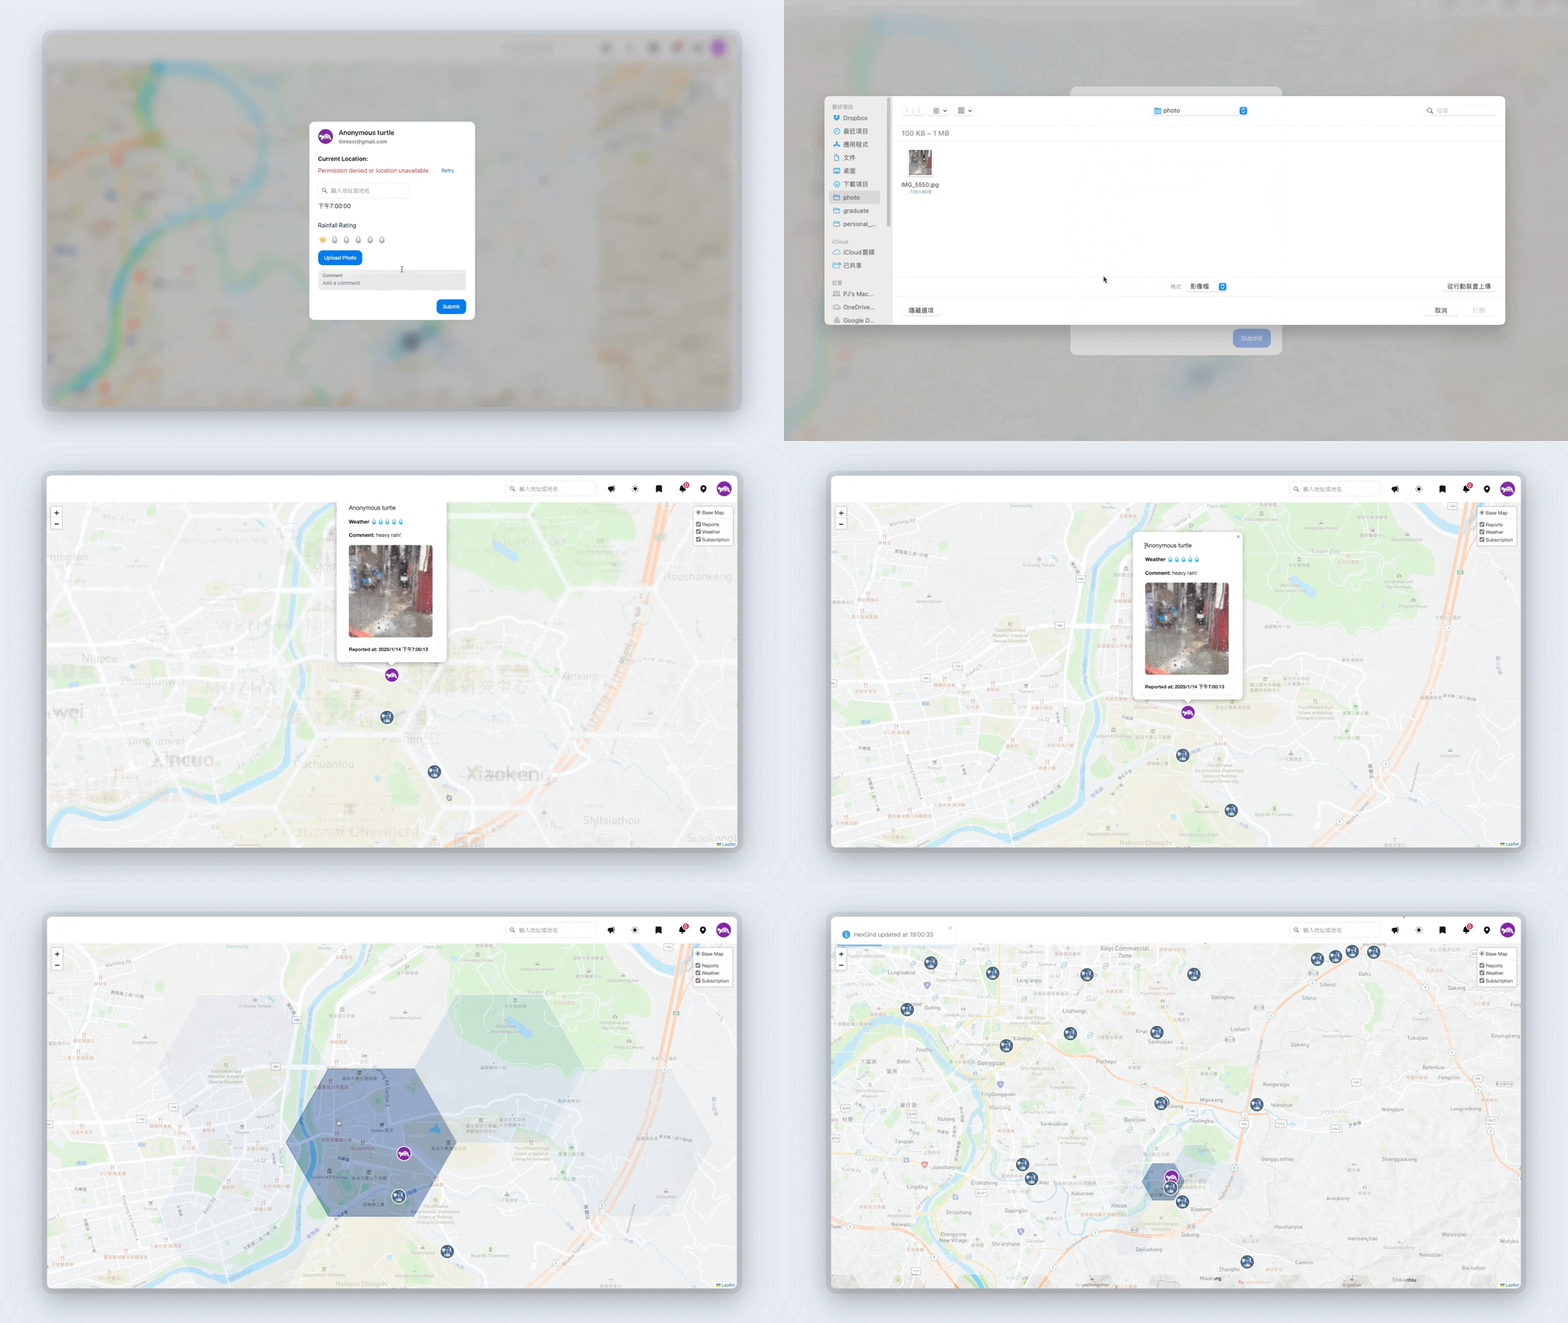
  • Rain reporting flow with photos + real-time map experience (Leaflet) and dark mode.
  • Subscription & notification system: region-based new reports, scheduled rain updates, and threshold-based alerts (in-app + email).
Pmap end-to-end demo

End-to-end demo: report → map → subscription → notification

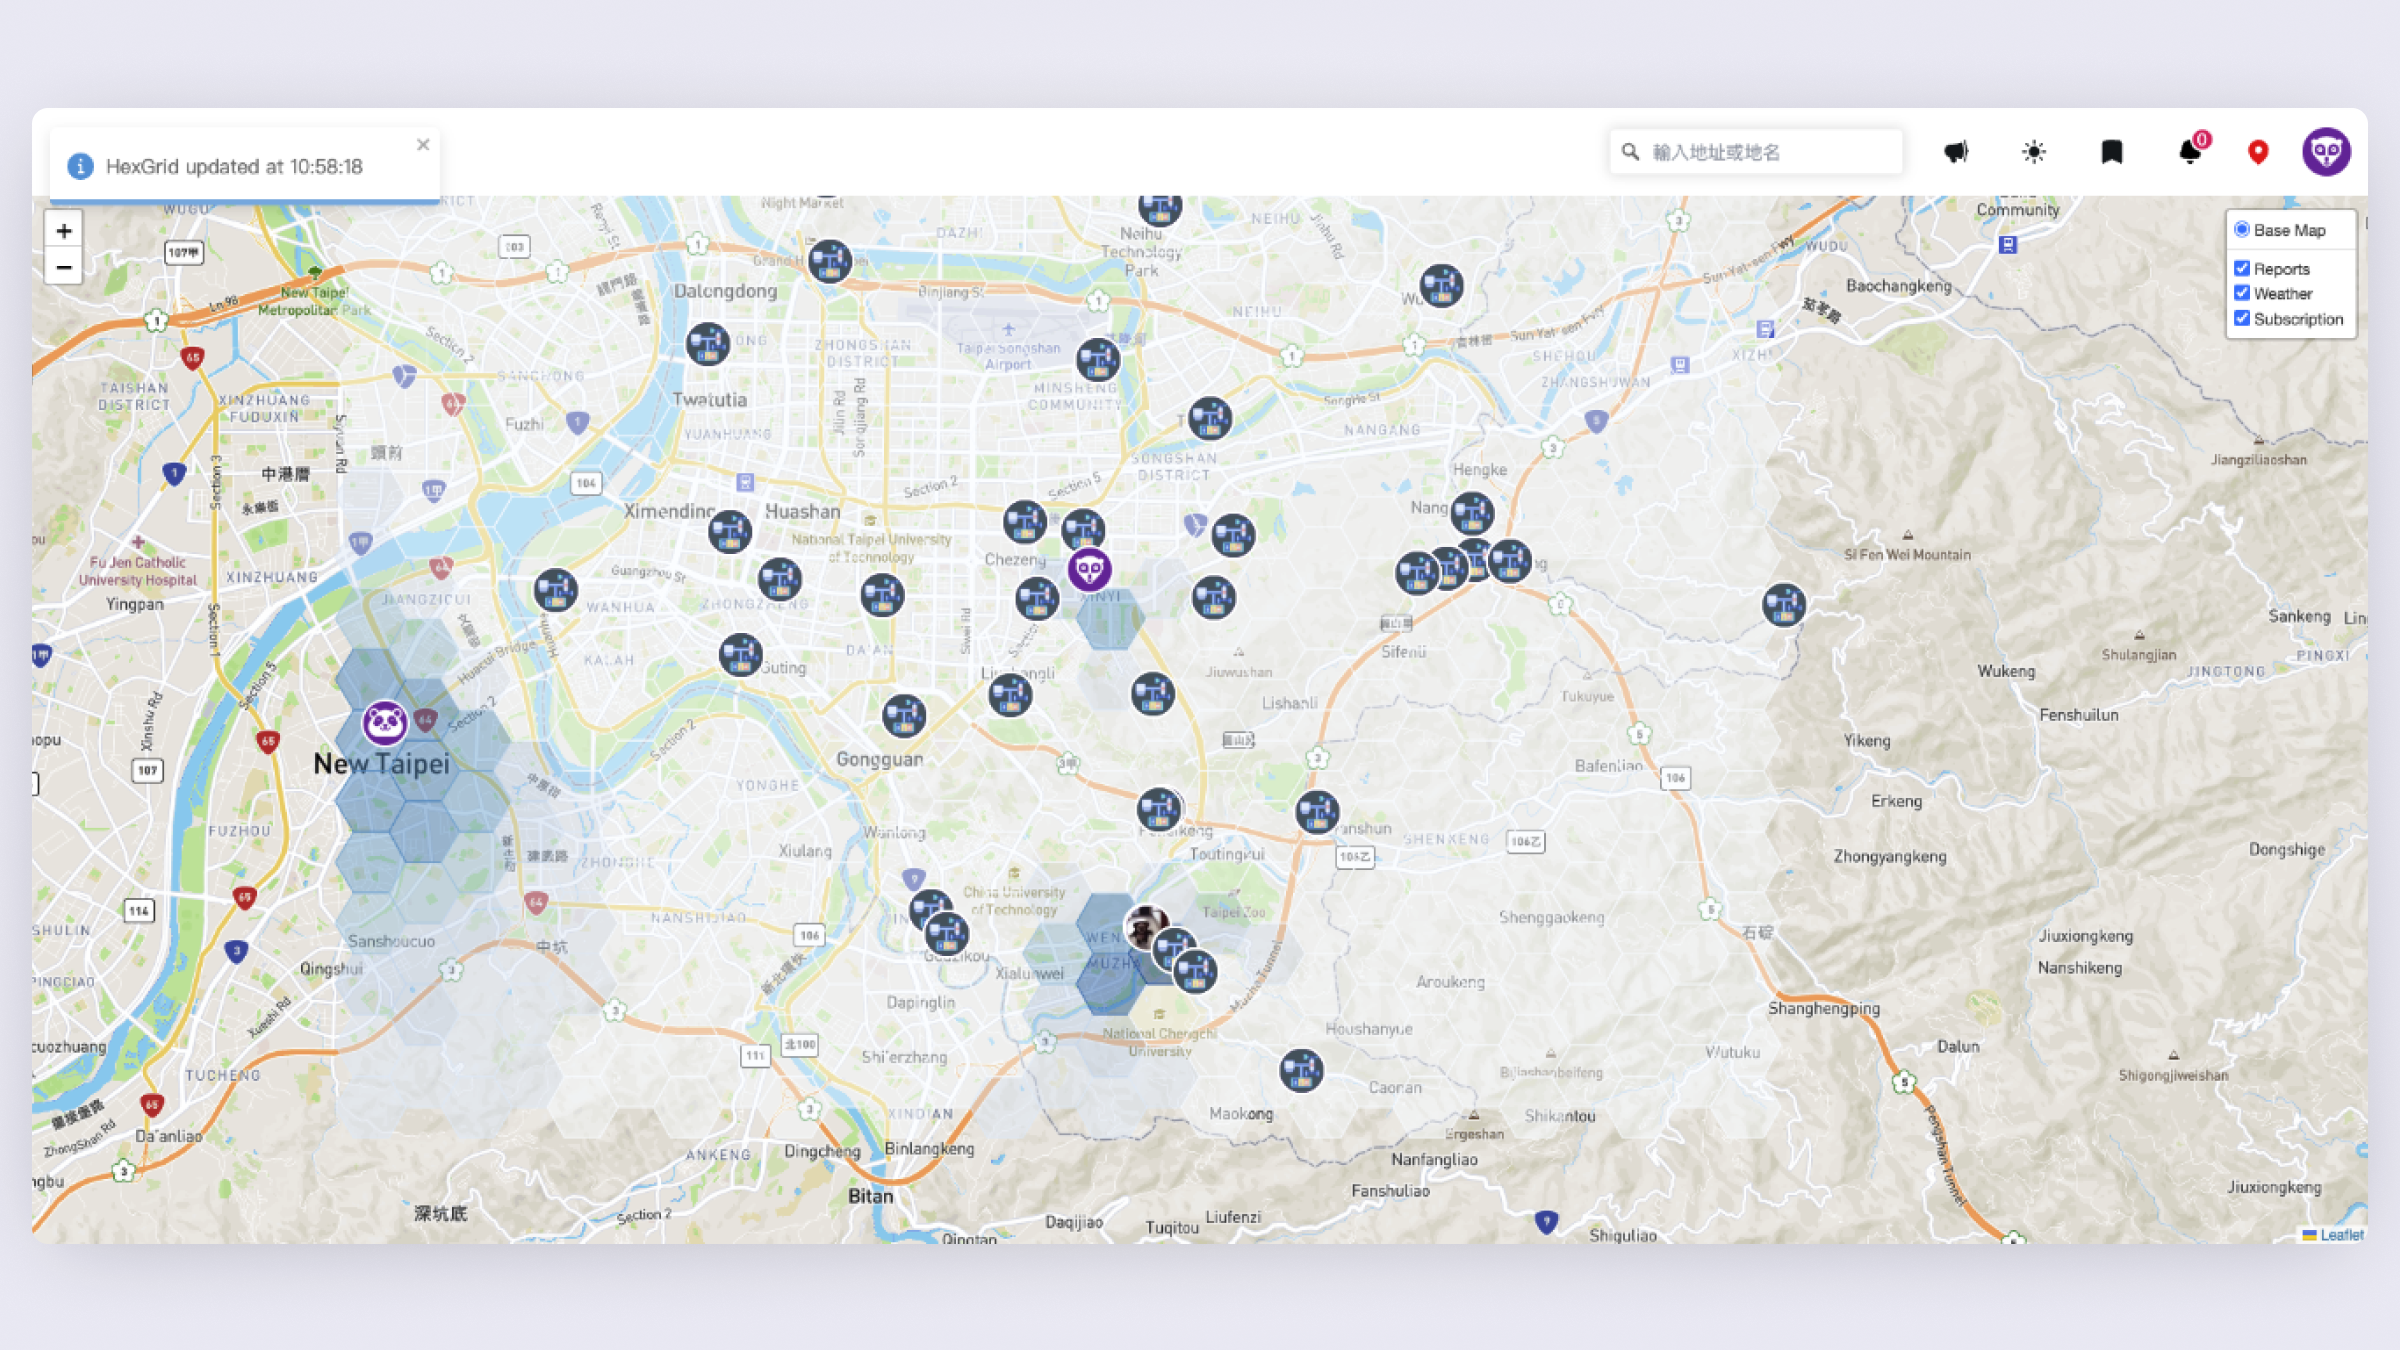
Real-time precipitation map

Real-time map fusing CWA station data and crowdsourced rain reports

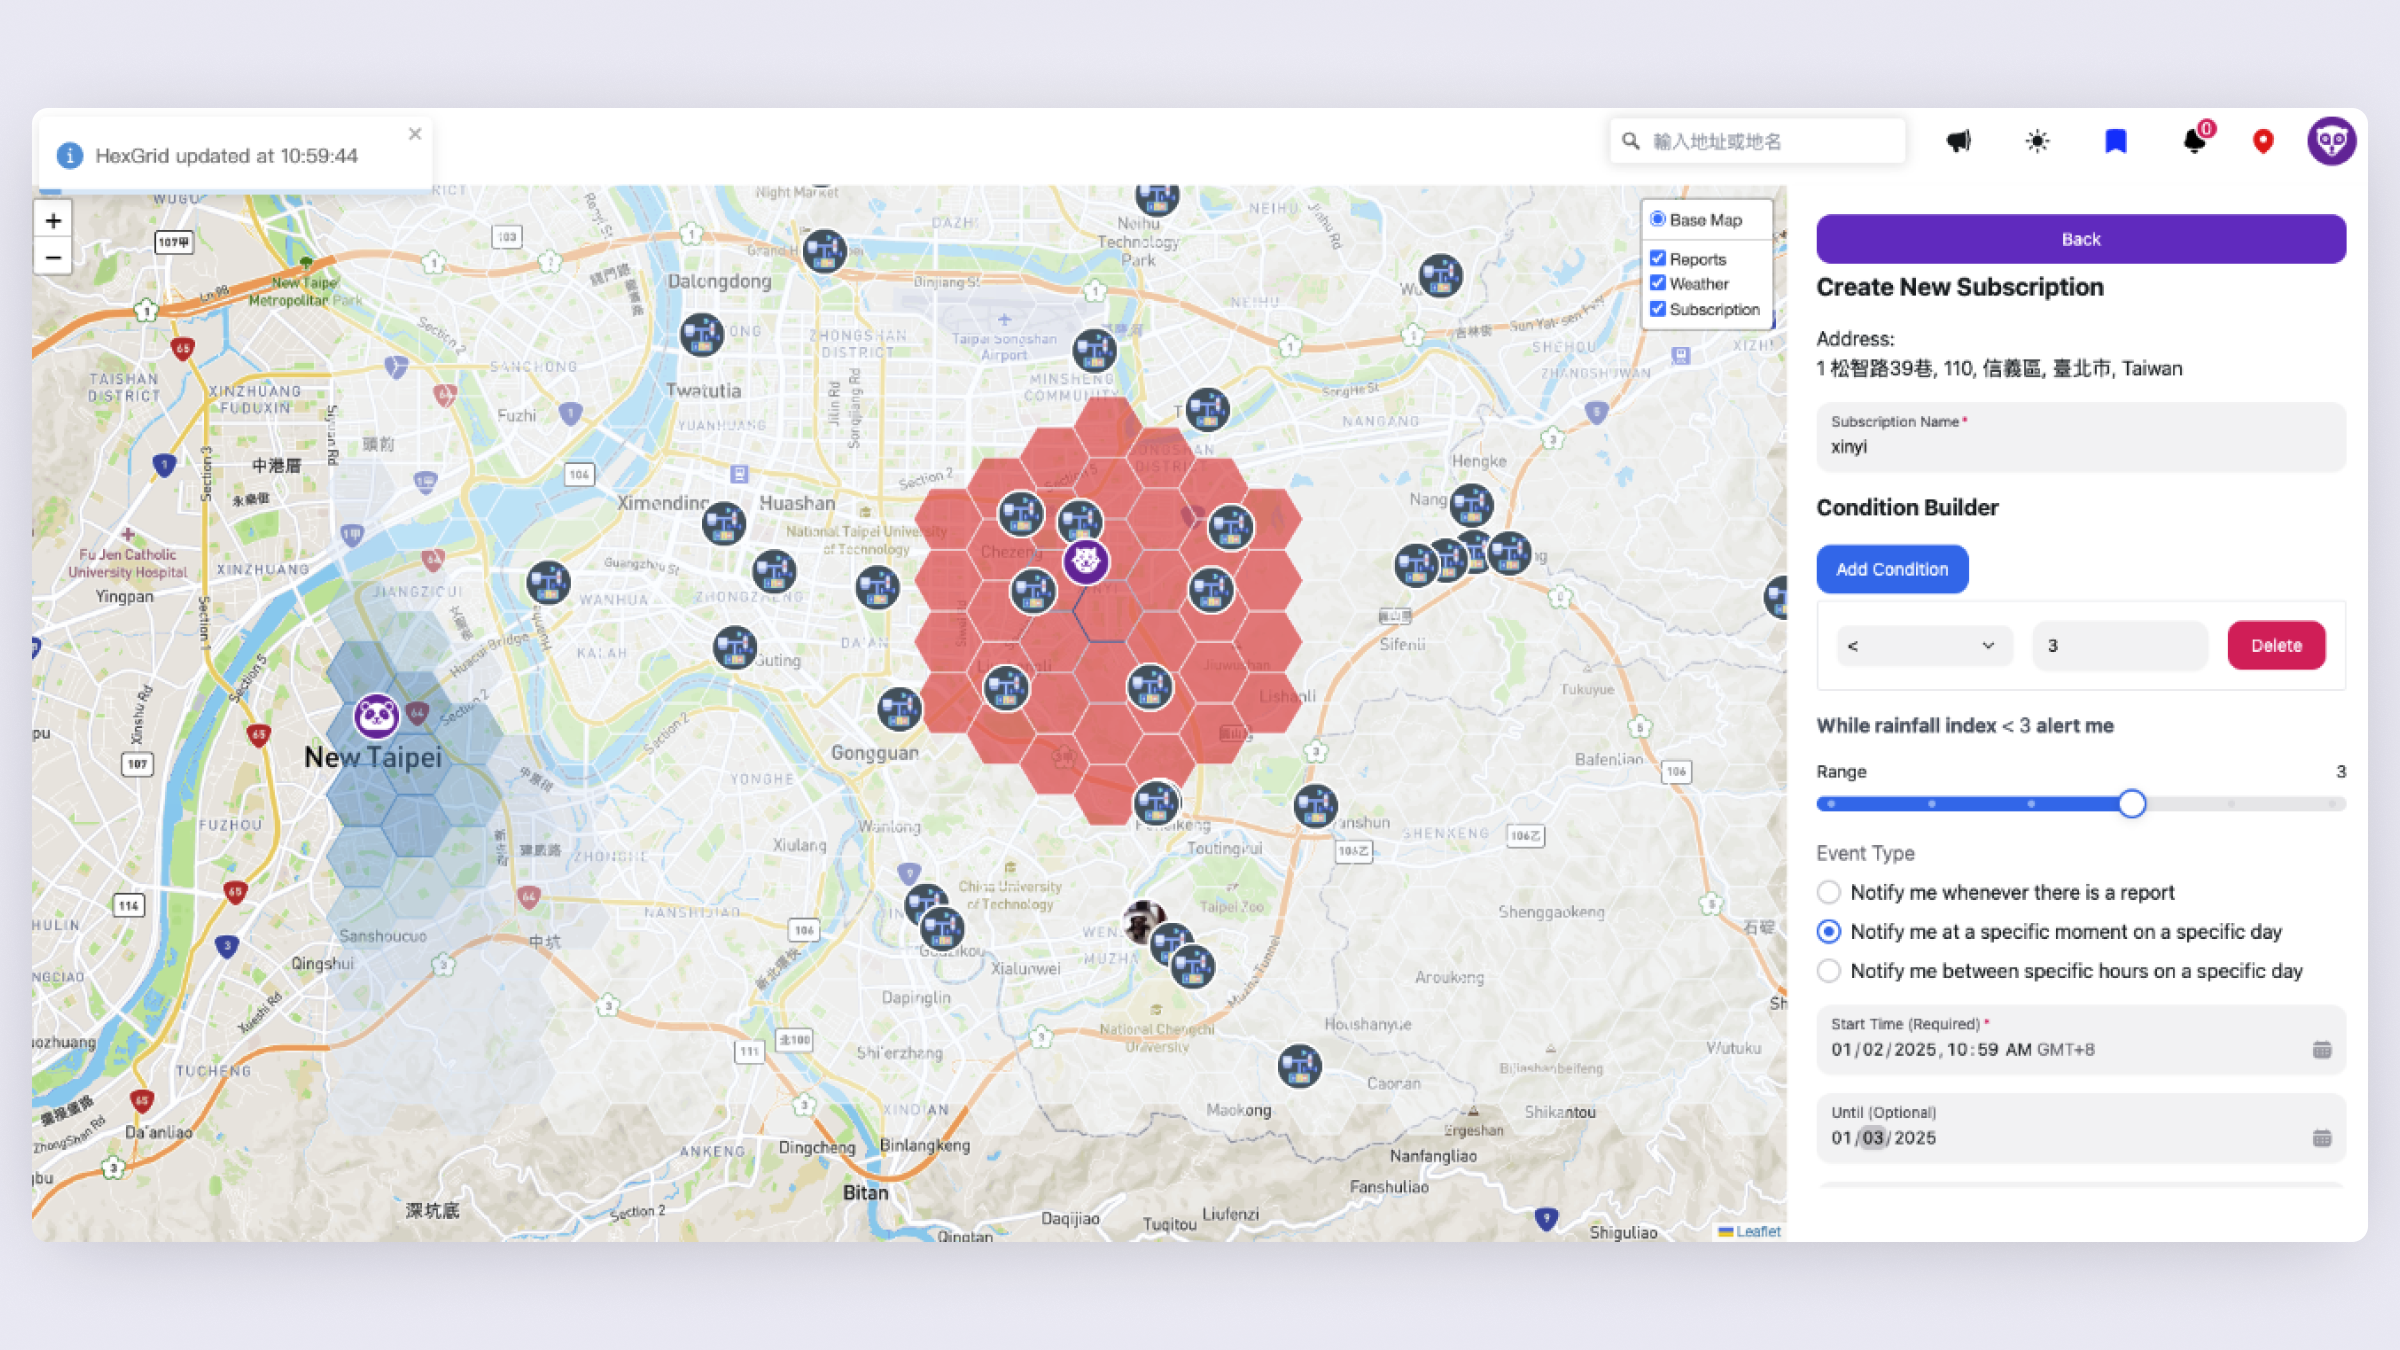
Region-based subscription

Region subscription — pick an area + rainfall threshold + event trigger

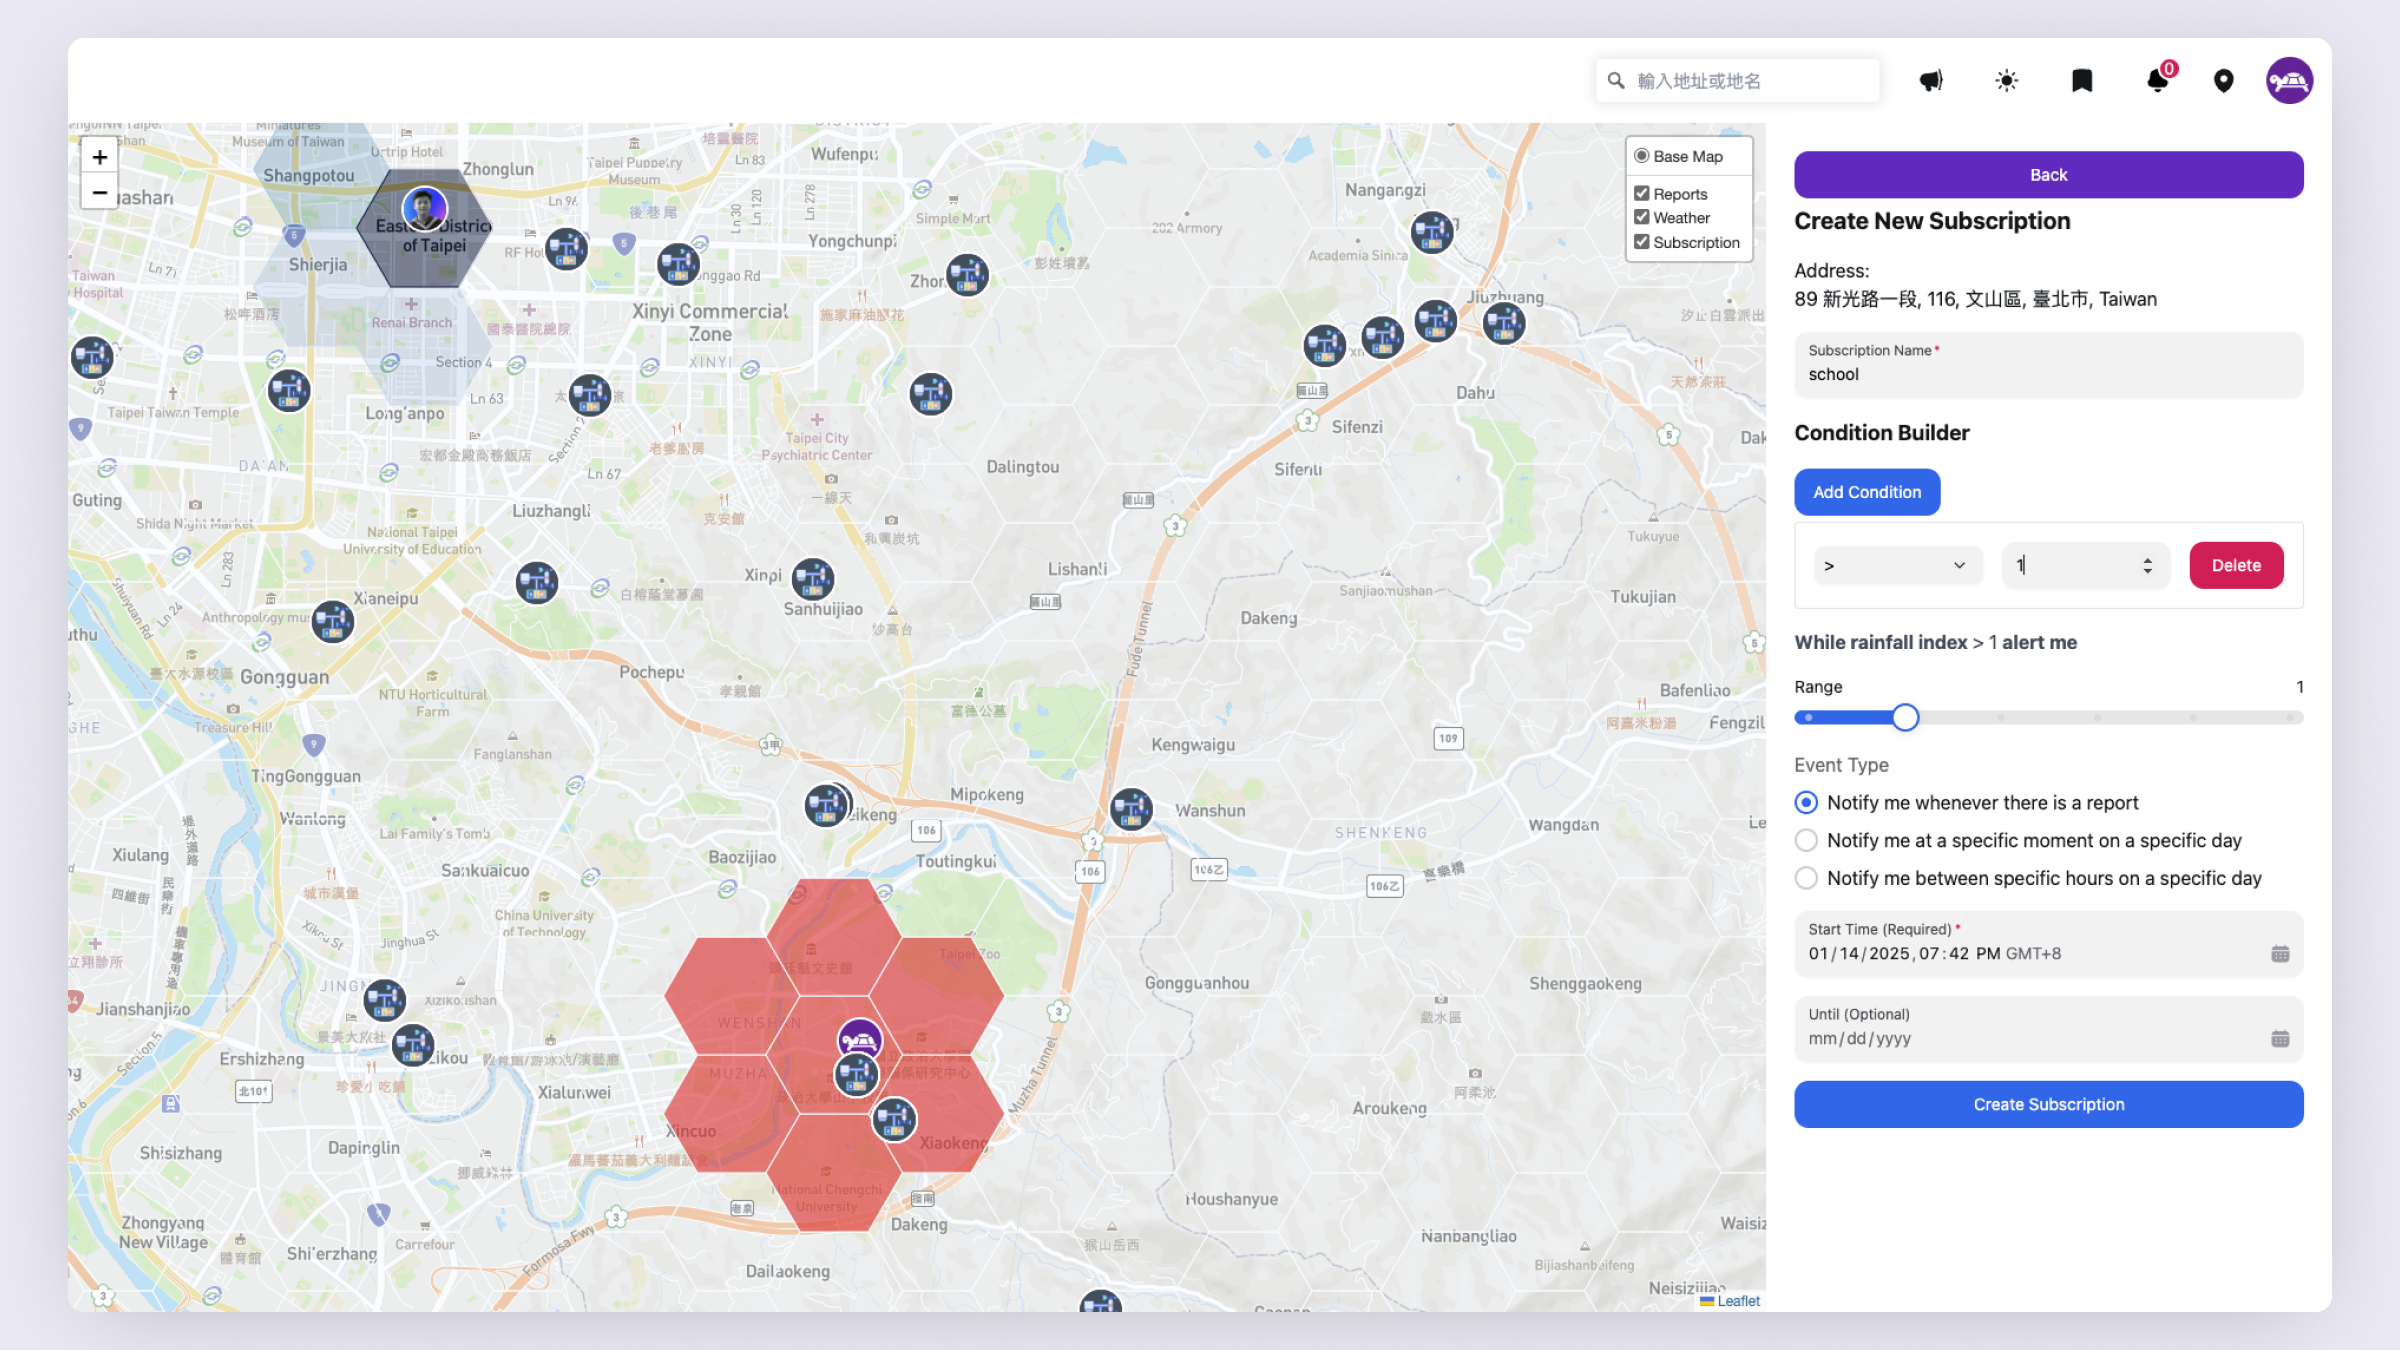
Refining subscription region

Refining the watch region and matching event types

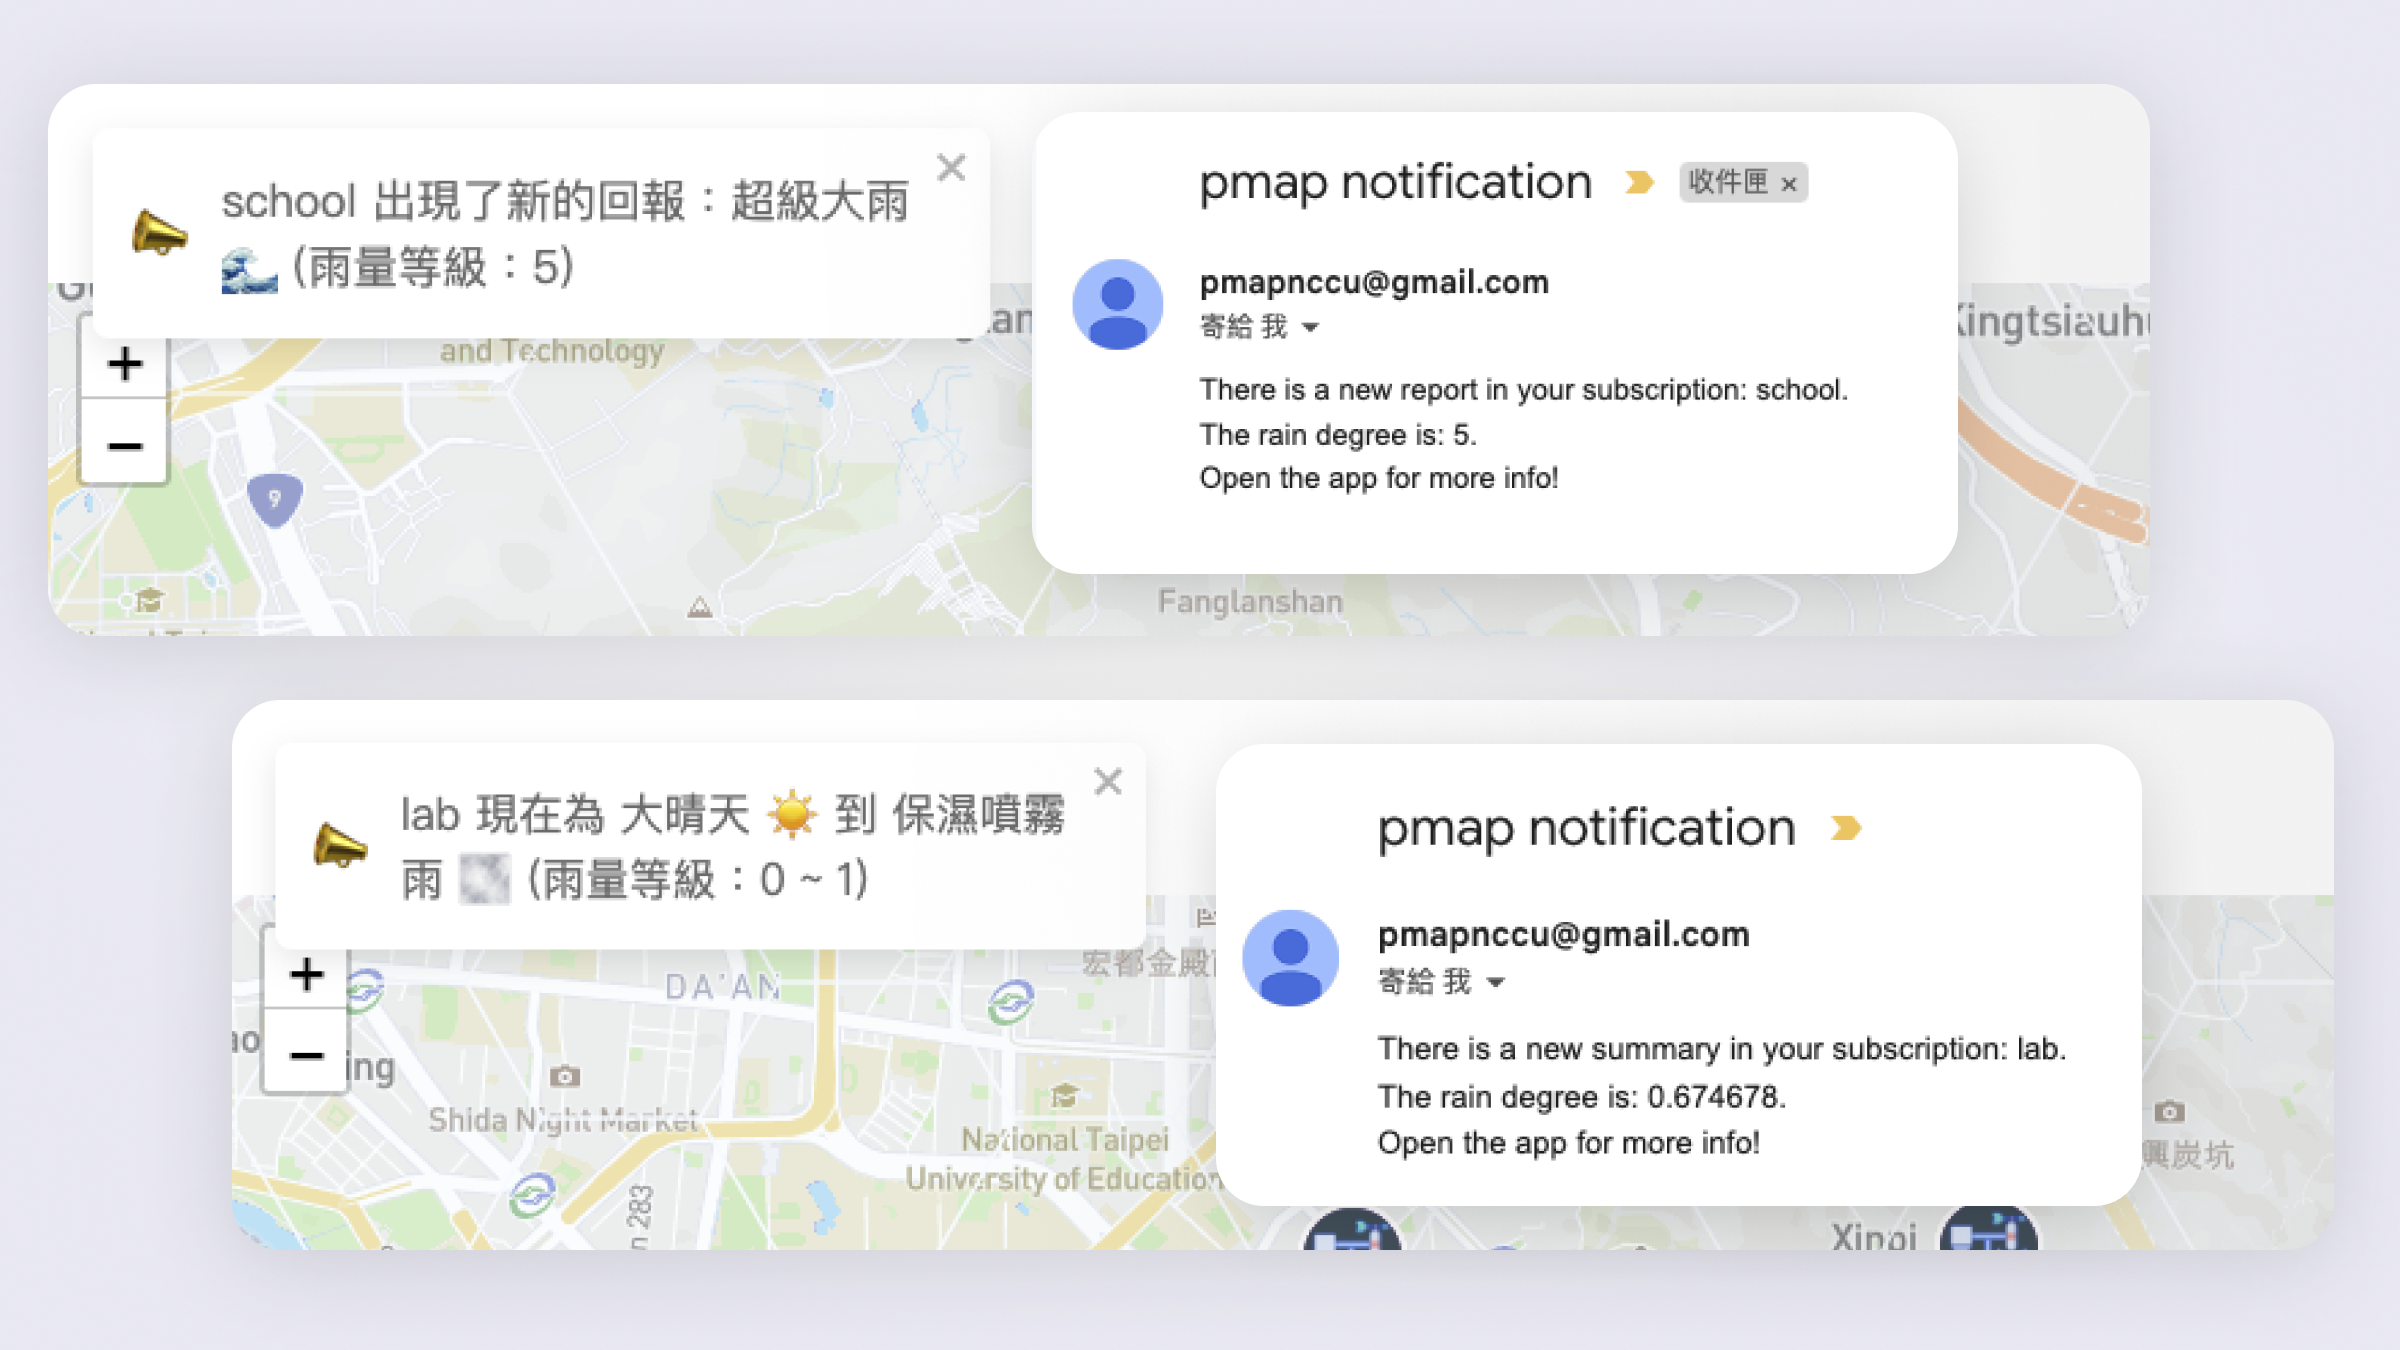
In-app + email notifications

Delivery: in-app banners and email when conditions match

System architecture

Architecture: VPC + Express/Redis/MySQL backend, MQTT broker, AWS Lambda for inverse-distance weather, S3 for blobs

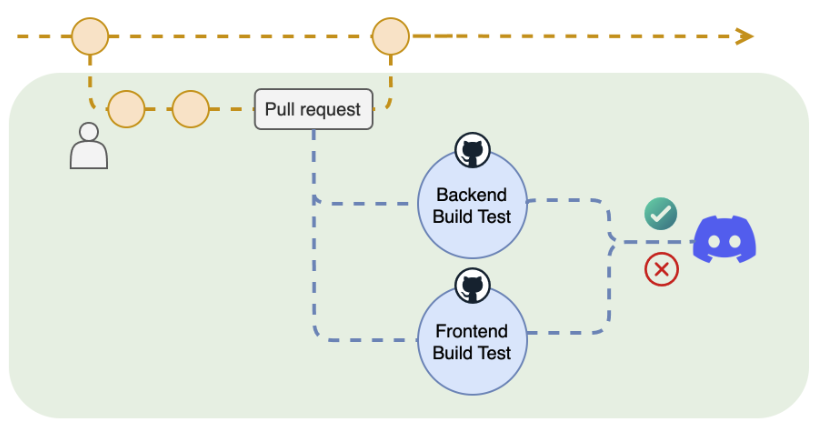
CI pipeline

CI: PR → backend + frontend build tests in GitHub Actions → Discord status

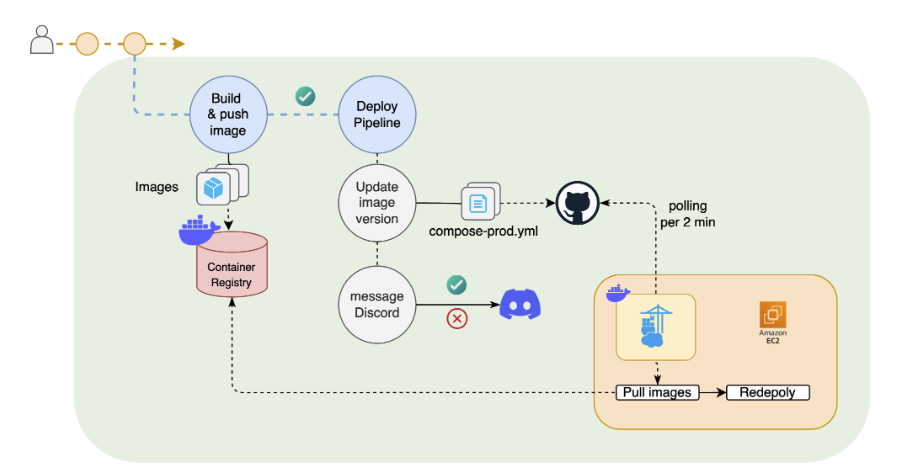
CD pipeline

CD: build & push → registry → EC2 polls compose-prod.yml every 2 min and redeploys

YOLO11.com
Real-time Inference · TensorFlow.js · Backend-free PoC

A demo website showcasing real-time object detection using purely TensorFlow.js without any backend dependencies. The Proof of Concept directly connects to the user's WebCam and is highly optimized to achieve over 80 FPS directly in the browser.

  • Purely browser-based inference using tfjs (no backend server required).
  • Direct WebCam integration for real-time video stream processing.
  • High-performance execution achieving over 80 FPS in-browser.

Live WebCam demo running YOLO11 in tfjs at 80+ FPS — no backend

YOLO11.com image inference

Image-mode UI: pick a YOLO11 task / model / size / thresholds, inference runs in-browser

Taiwan Public Bicycle System Analysis
1st Place, National Competition
Time Series + Interactive Mapping (2021) · Spatio-temporal Insights (2024)

Created an end-to-end spatial-temporal analysis framework to investigate public bicycle usage patterns. By combining time-series clustering and Random Forest feature evaluation, this study reveals critical insights into last-mile transportation dynamics and urban mobility integration.

  • Automated scraping + longitudinal station dataset (pandas) for trend analysis over time.
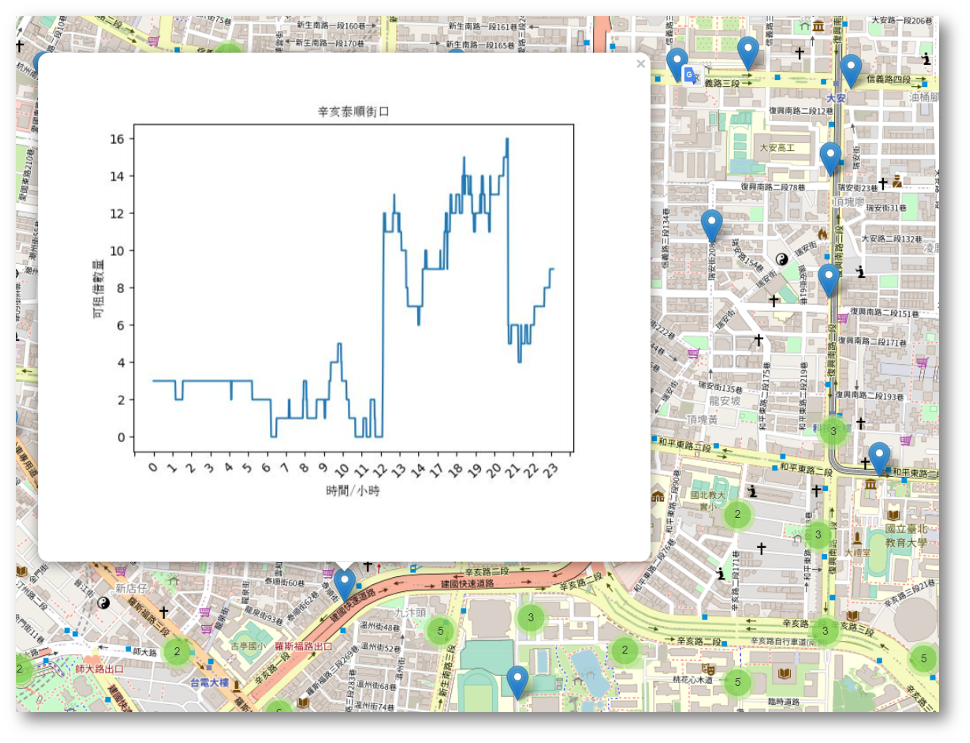
  • Interactive Folium map with per-station matplotlib time-series popups for exploration.
  • 2024 analysis: DBSCAN station development, last-mile + MRT transfer issues, Random Forest feature impact; won 1st Place in the National Storymaps Competition.
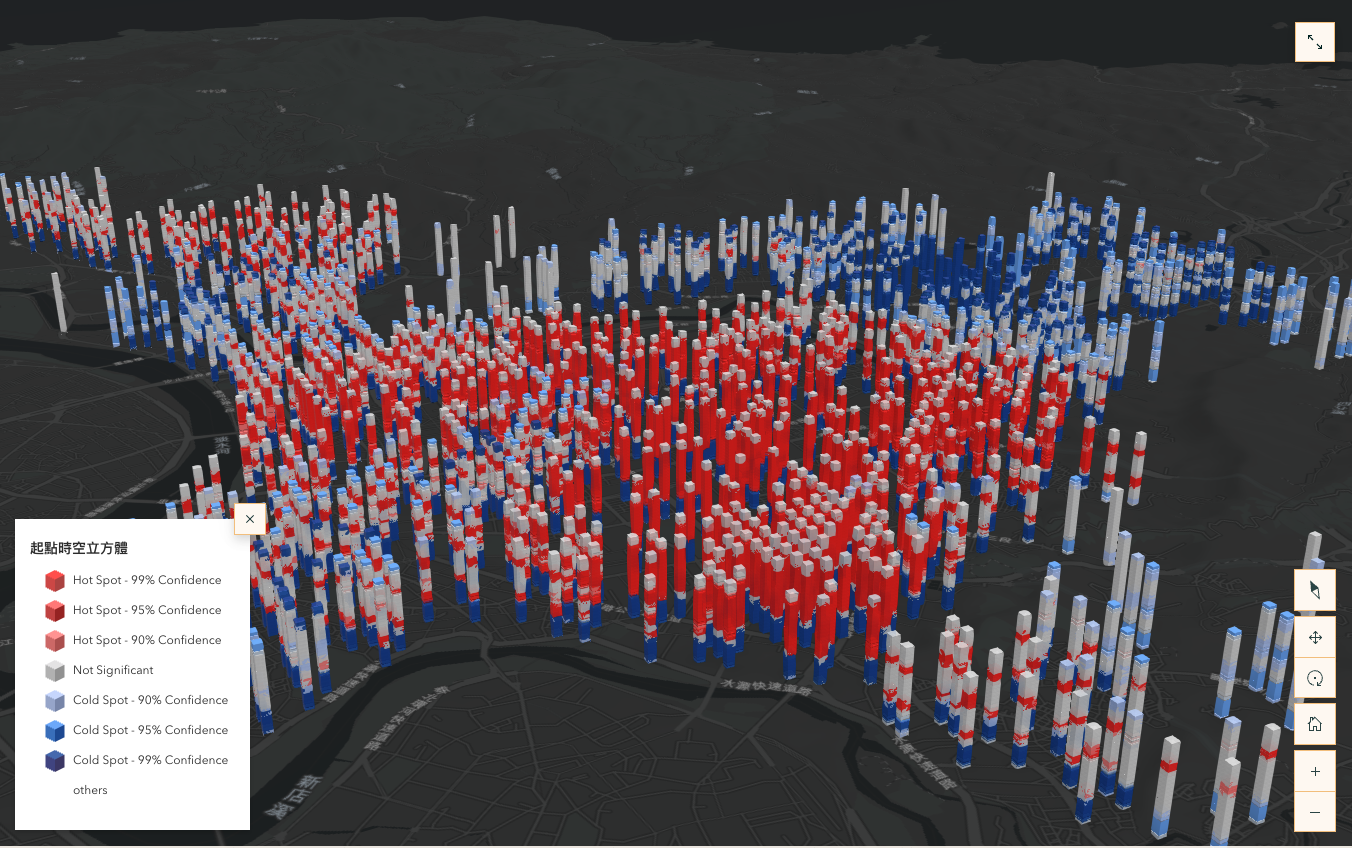
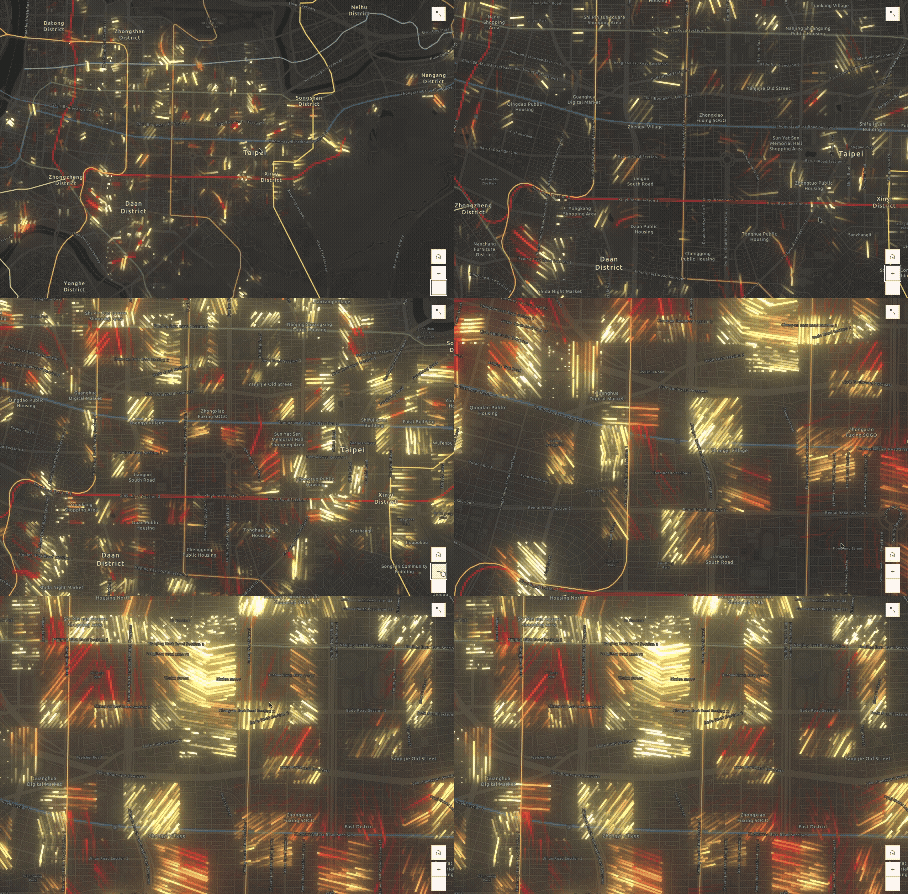
Space-time cube of station hot/cold spots

3D space-time cube of station hot/cold-spot intensity over time

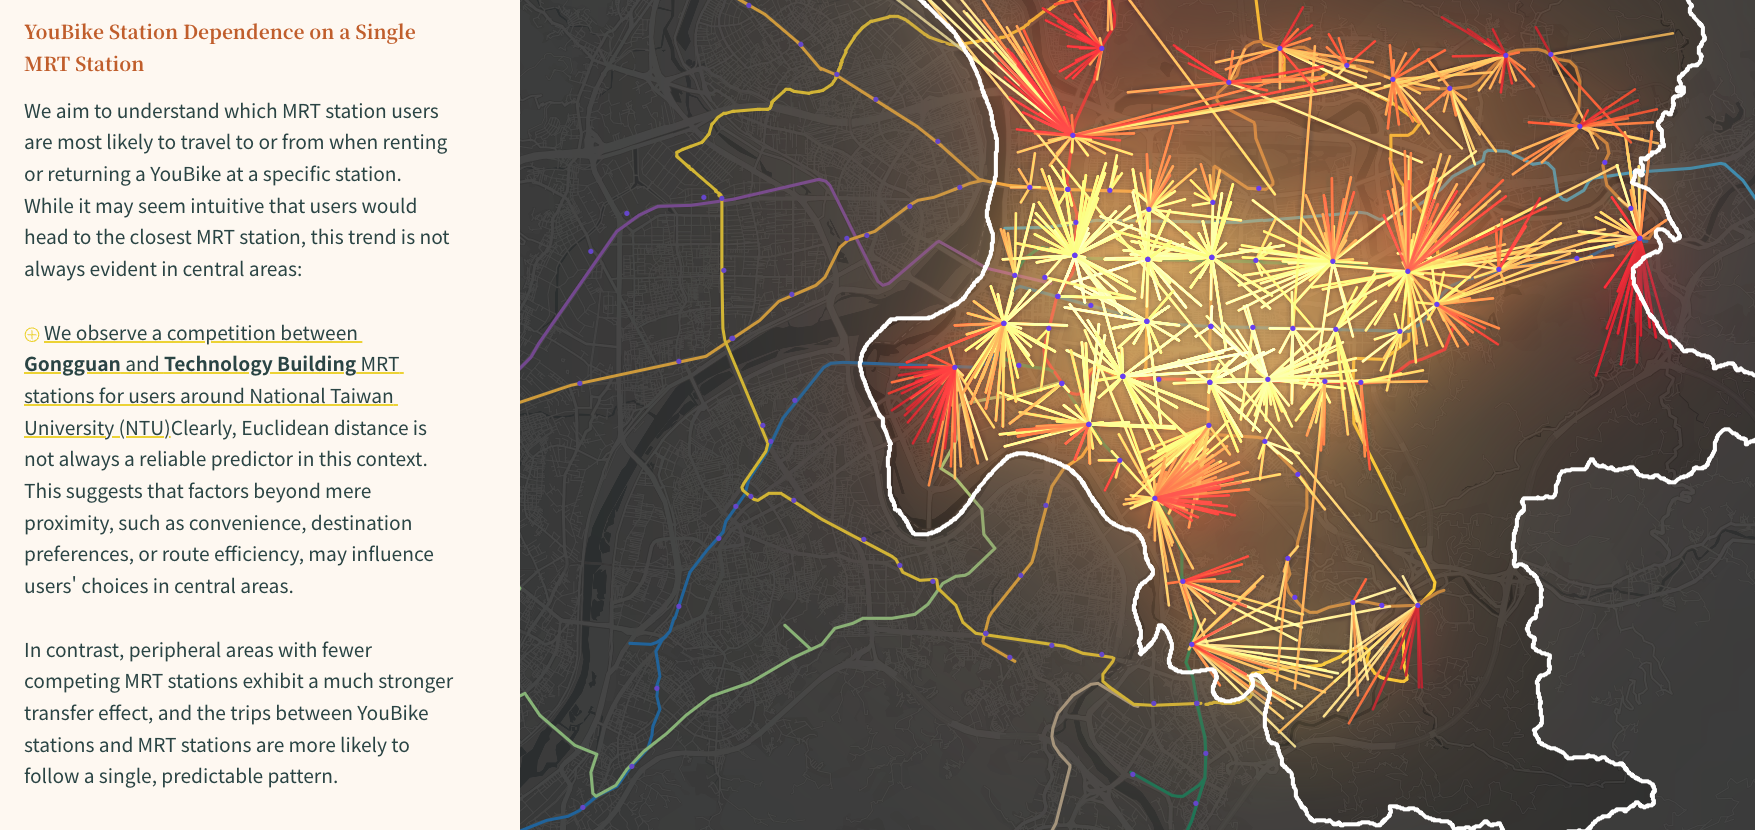
Bike–MRT transfer flows

Transfer flows between YouBike and MRT around NTU — central stations show multi-station competition

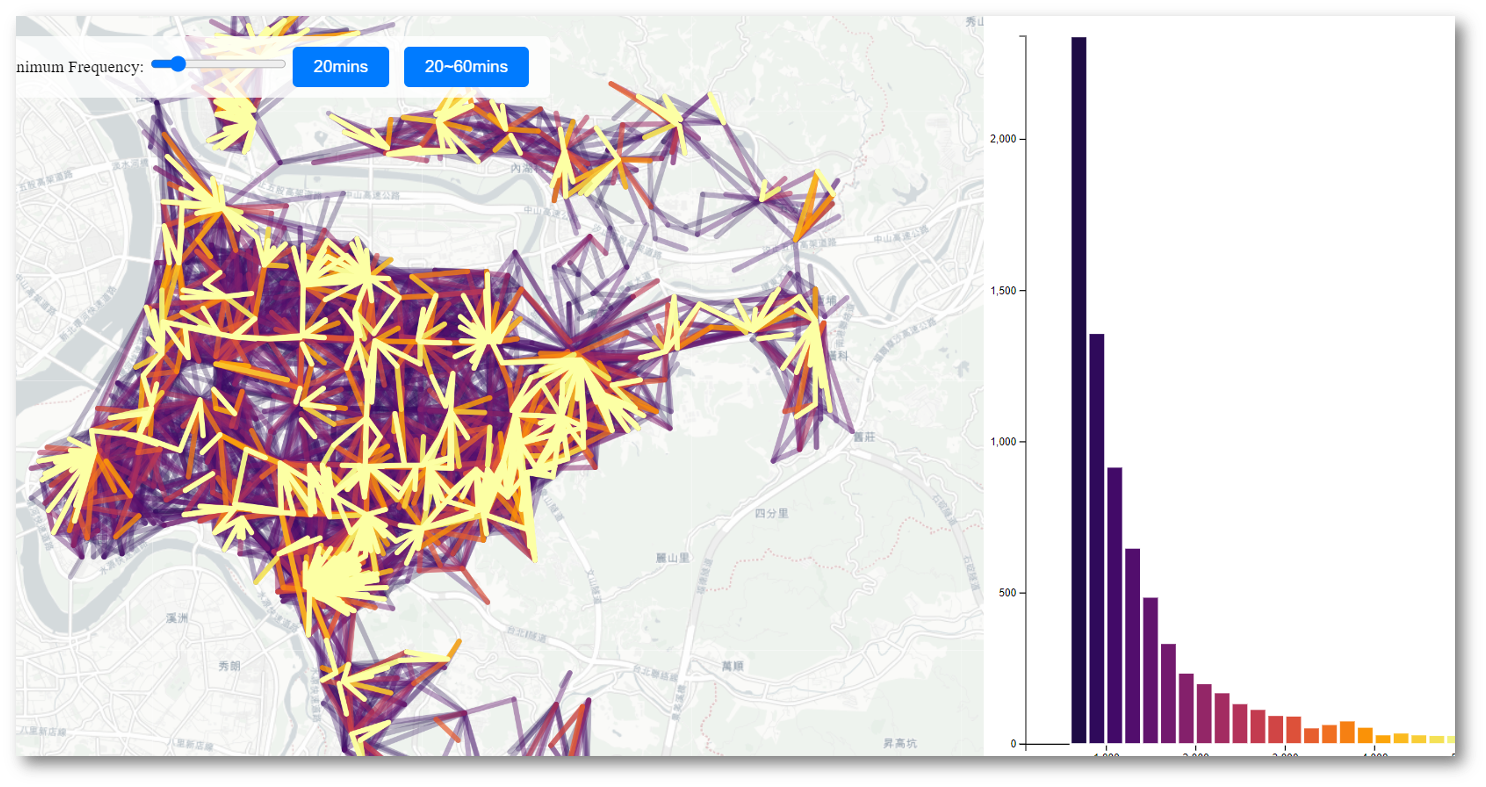
Origin-destination flows

Origin–destination flows + trip-distance histogram

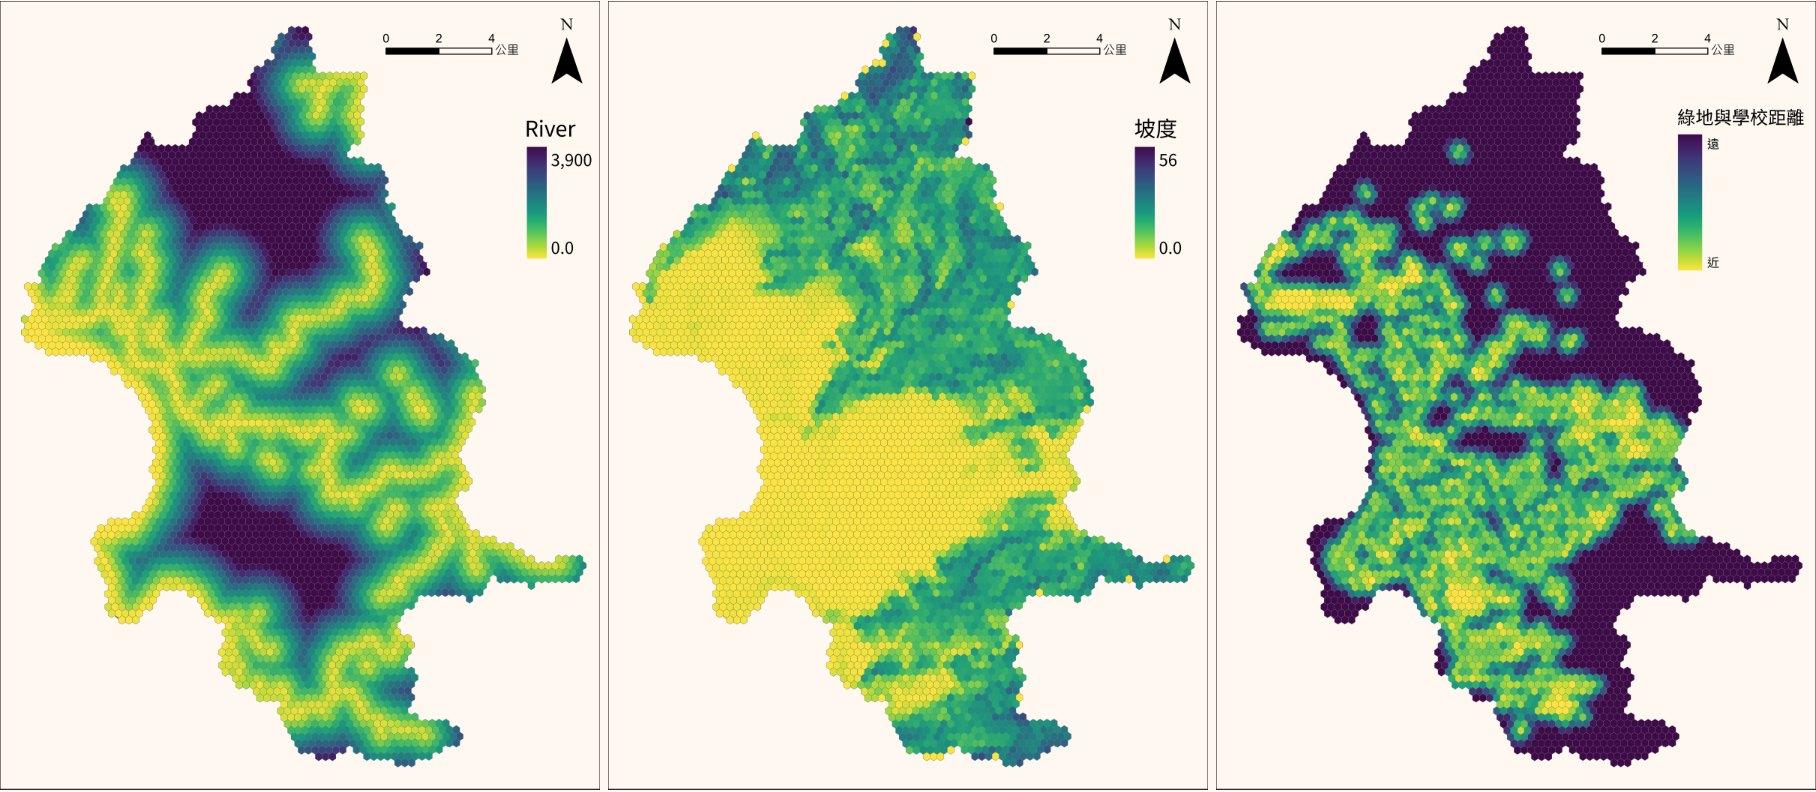
Random Forest features (1)

Random Forest features: distance to river, slope, school density

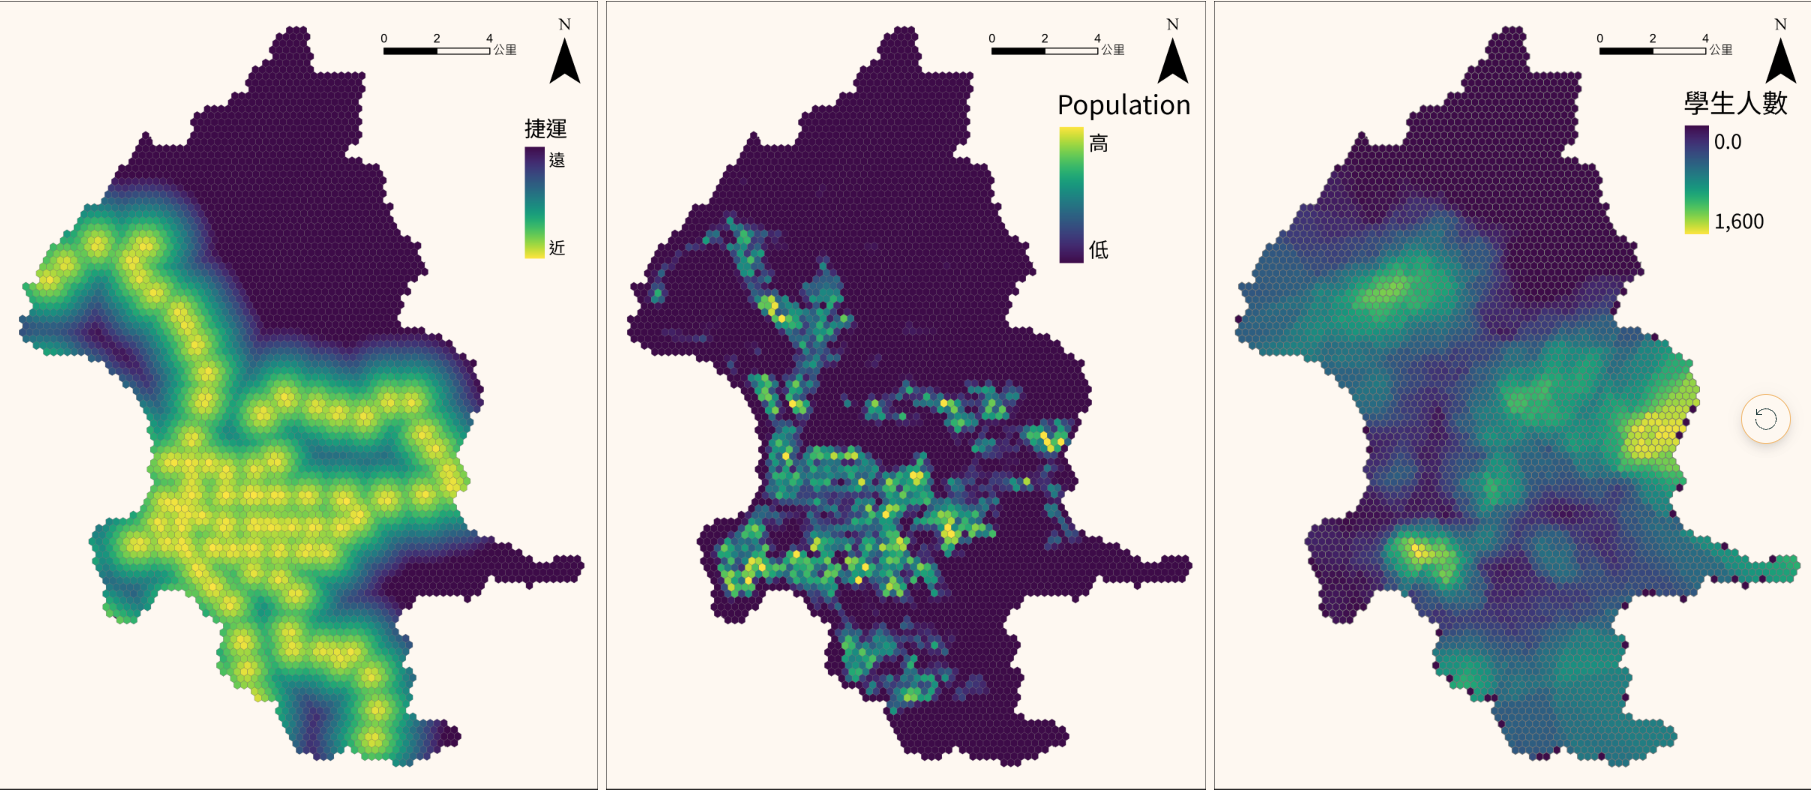
Random Forest features (2)

Random Forest features: building density, population, student count

YouBike data pipeline

Data pipeline: scrape open data → pandas → matplotlib → Folium popup

Folium popup with time-series plot

Per-station Folium popup embedding a matplotlib time-series chart

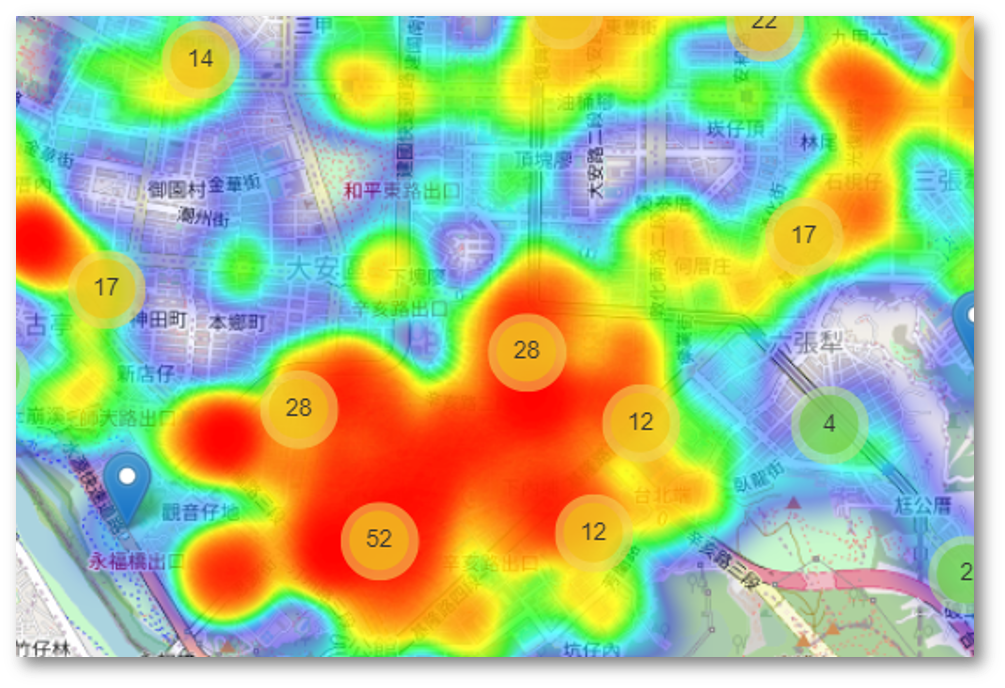
Station-density heatmap

Station-density heatmap of usage hotspots

Taiwan Convenience Store Analysis
1st Place, National Competition
Spatial Pattern (2021) · Spatio-temporal Prediction (2023)

Investigated the Hotelling's spatial competition model in urban retail networks and developed a spatio-temporal prediction pipeline. This work provides an analytical framework for identifying optimal facility locations, balancing competition and coverage in metropolitan planning.

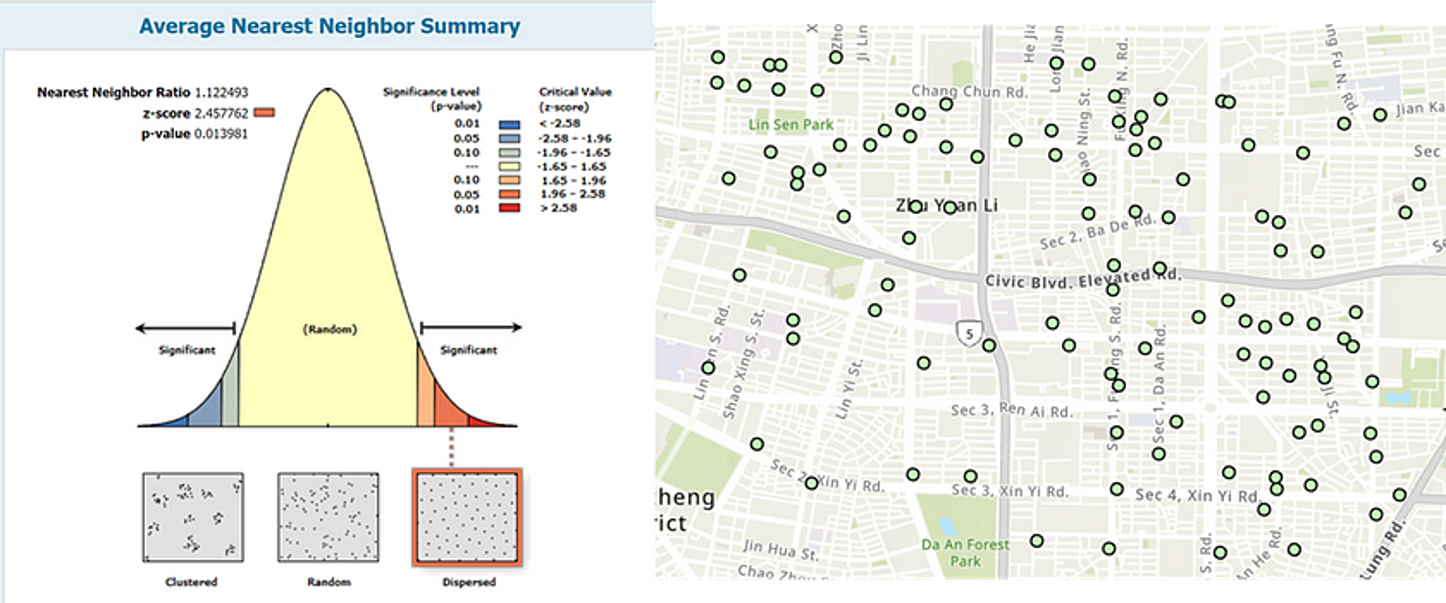
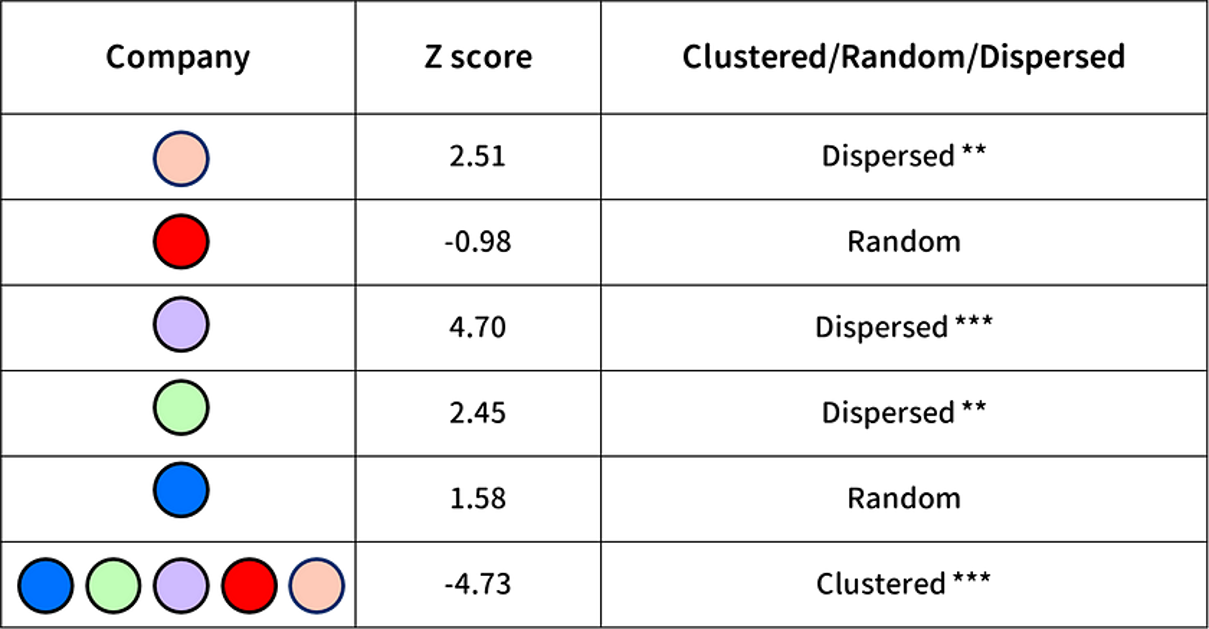
  • ANN-based spatial pattern analysis for five major convenience store chains (Taipei metro).
  • Spatio-temporal prediction built with suitability analysis, space-time cube, and MGWR; validated statistically.
  • Won 1st Place in the National Storymaps Competition; detailed Medium write-up linked.
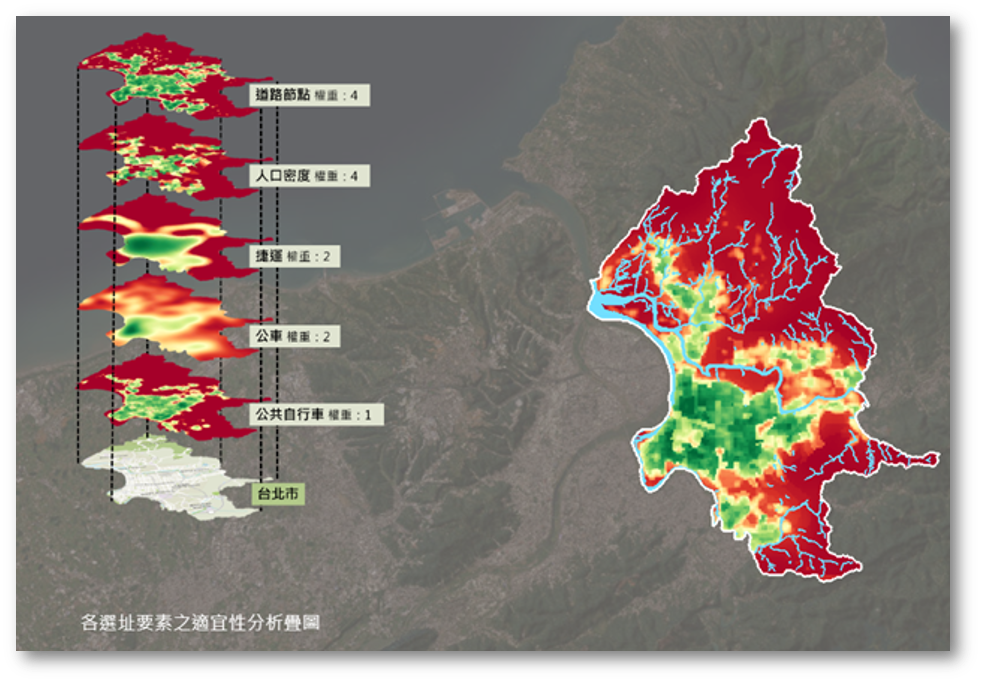
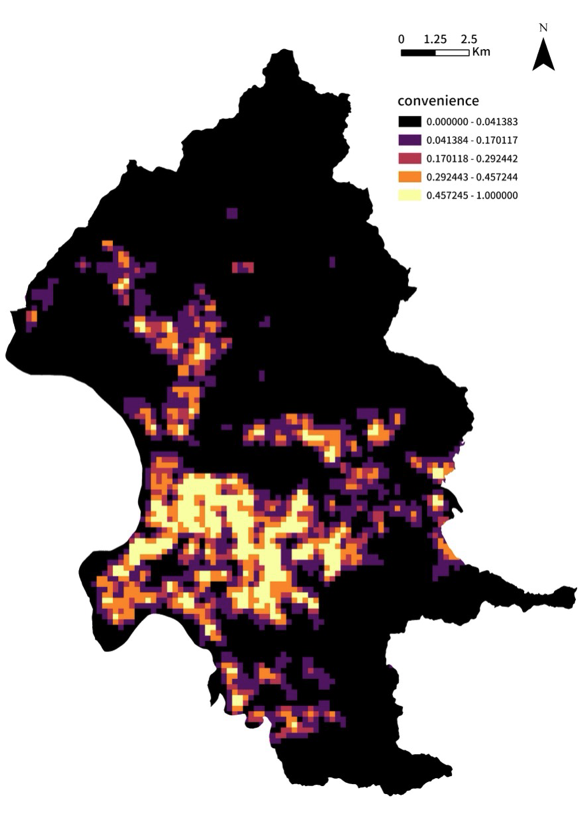
Suitability surface

Suitability surface combining accessibility, demographics, and competition

MGWR predicted density

MGWR-predicted convenience-store density across the metro area

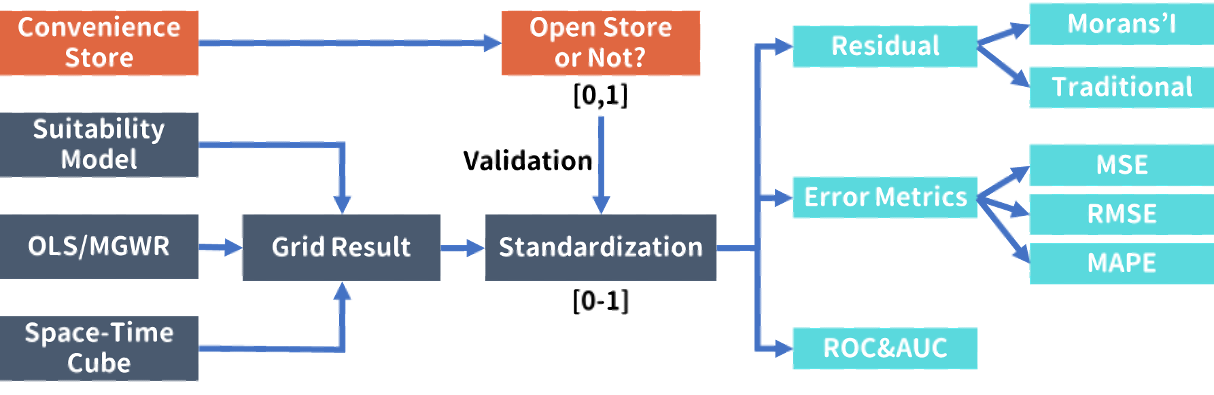
Validation pipeline

Validation pipeline: suitability + OLS/MGWR + space-time cube → grid → metrics (RMSE / Moran's I / ROC-AUC)

ANN summary diagram

Average Nearest Neighbor distribution + sample point map

ANN Z-score table

ANN Z-scores by chain — dispersed individually, clustered when grouped

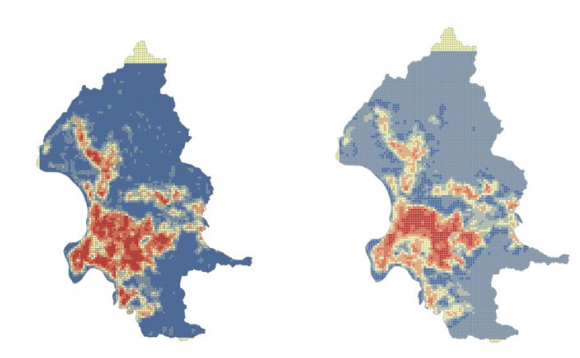
Collaboration vs competition density maps

Density maps: intra-chain collaboration (left) vs inter-chain competition (right)

Technical Skills

AI, ML & Geospatial

PyTorch
SAM
Milvus
ArcGIS
OpenLayers
R

Backend & Systems

Rust
C / C++
Python
FastAPI
Flask
Node.js
Kafka
Redis

Cloud & DevOps

AWS
GCP
Kubernetes
Docker
GitHub Actions
Jenkins
GitHub
Git

Frontend & Web

TypeScript
JavaScript
React
Next.js
Nuxt.js
Vue
Vercel
Postman

Contributions Calendar

@chuang091